  
|
Posted By Alex Cooper, Canadian Avalanche Association,
April 1, 2020
|
From volume 78, winter 2005-06
By Greg Johnson and Karl Klassen

PHOTO: CHRIS CHRISTIE
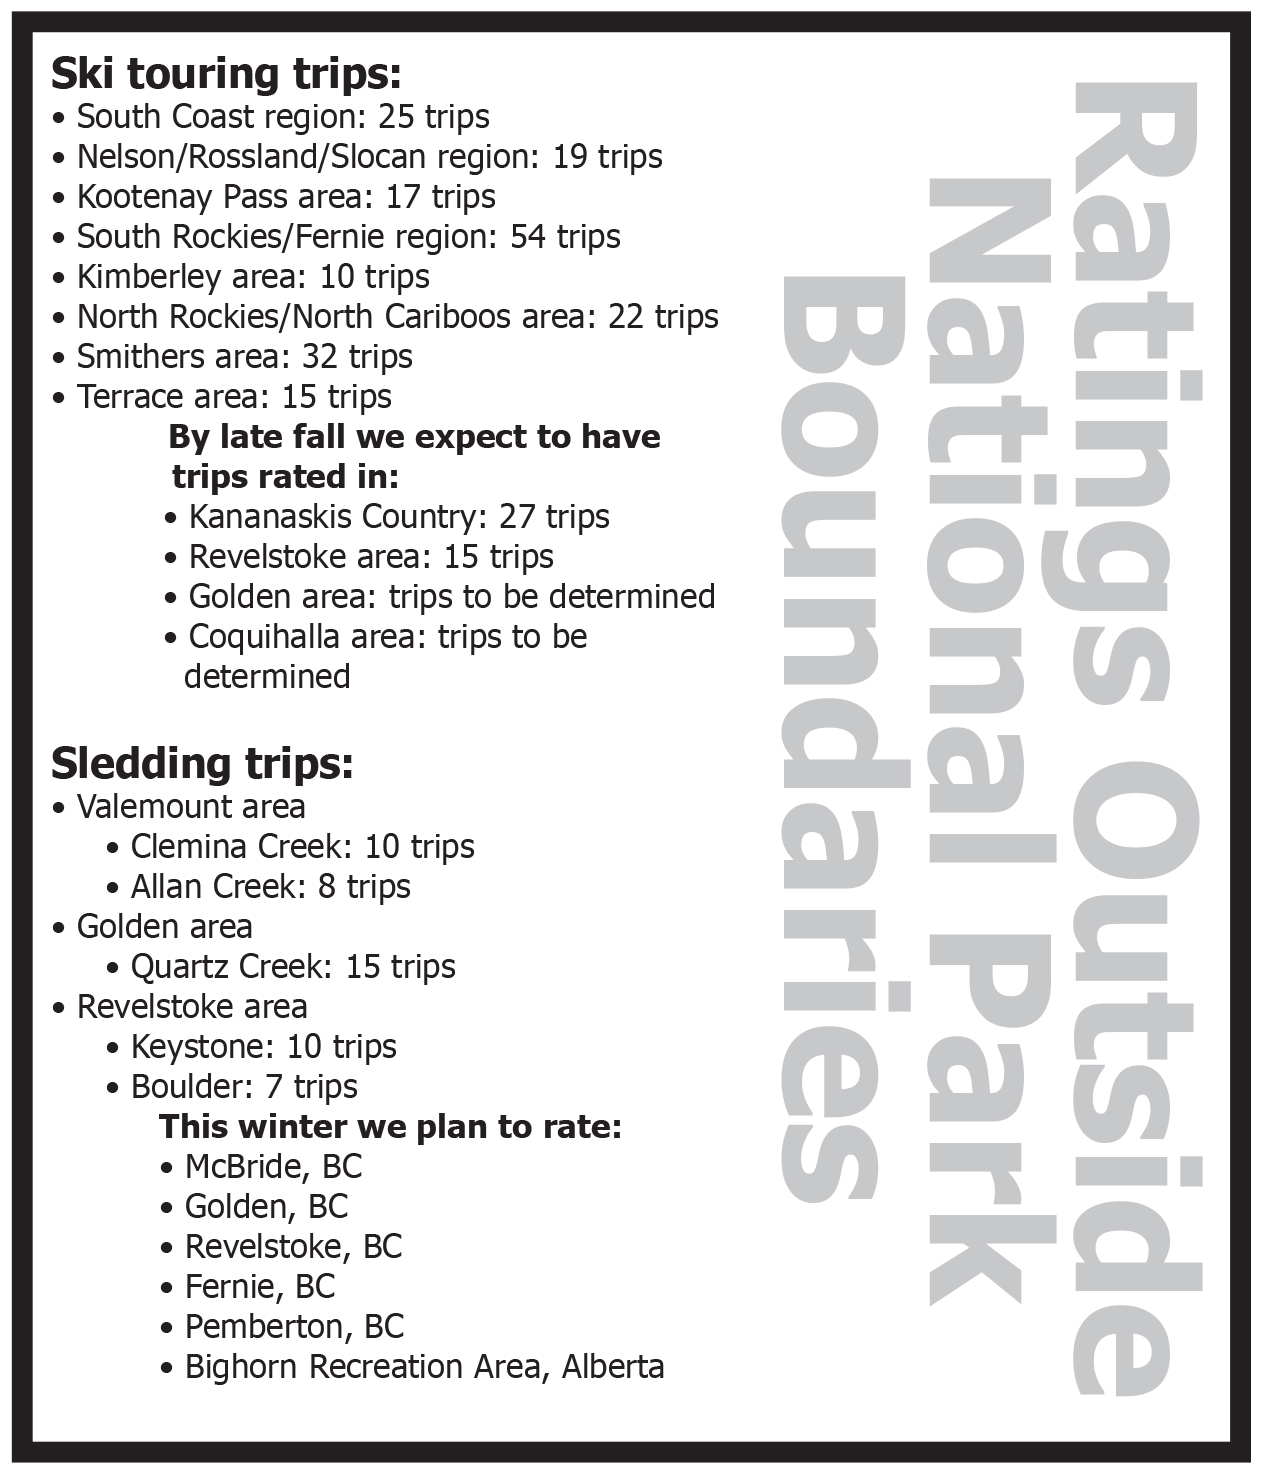
The new Avaluator will soon be on the market. The prototypes for this tool show great promise as an effective solution to a complex problem, and have garnered critical acclaim from risk specialists. However, to apply the trip-planner effectively, the user depends on two important factors: an avalanche danger rating and an avalanche terrain exposure scale (ATES) rating. The first is a well-established system, and a current danger rating can be found for most places in western Canada frequented by winter backcountry users. The ATES system, developed by Grant Statham and Bruce McMahon of Parks Canada, is newer and to date has been implemented almost exclusively within the National Mountain Parks.
The ATES is a three-level scale that rates terrain as simple, challenging, or complex. These ratings give backcountry users an idea of the risk that is presented by terrain prone to avalanches. In preparation for the Avaluator’s public launch this winter, project manager Pascal Haegeli contracted us to rate popular ski trips beyond national parks boundaries. In addition to this not insignificant challenge, the contract included doing something that had never been done before: developing ATES ratings for snowmobile trips.
The process of assessing ATES ratings requires using the scale’s technical version. The development of this scale is discussed in an excellent article written by Grant and Bruce for the Fall 2004 issue (vol. 70) of Avalanche News. You can also find the ATES technical version on the Parks Canada webpage by entering “avalanche terrain exposure scale” in the keyword search. The technical version employs 11 weighted terrain factors for use by trained professionals to generate ratings that remain consistent from one area to the next and from one assessor to the next.
Karl, who is busy building a house in Revelstoke, landed the easier side of the job—rating the ski trips. Greg, who had only to deal with buying and moving into a new house and planning his own late-August wedding, took on the more complex task of adapting the ATES for sledding trips and rating some popular riding areas. Figuring out how the ATES would work for sledding applications was tough at first, but once that hurdle was overcome, this portion of the project turned out to be fun.
Clearly, rating all ski and sled trips in Canada is a gargantuan task requiring more time and resources than the ADFAR project can muster at this point in its development. Our goal was to first identify general areas where skiers, boarders, and sledders can be regularly found in the backcountry. We decided on these areas based on personal and professional knowledge of the backcountry, our experience as CAC avalanche forecasters, and through dialogue with professional and experienced recreationists in various mountain communities.
We then developed short lists of popular trips commonly traveled by recreationists in these areas. This was done by soliciting opinions from local professional and recreational users. Once we had these trips listed, we looked at our timelines and budgets, and then prioritized the trips to ensure we would geta representative cross-section of trips and tours throughout the Columbia, Coast, and Rocky mountains.
At this point we were ready to begin establishing ATES ratings, thus allowing practical use of the Avaluator in BC and Alberta when it is launched in the fall. Our paths diverged somewhat at this point: Karl sub-contracted people in various areas to carry out further work on ski-touring trips while Greg went into the field to look at snowmobiling terrain and develop the database for sledding trips.
Rating snowmobile trips proved to be a different process than rating ski trips. Sledders differ from skiers due to the nature of the machine, how the users select their terrain, and how much area they cover. Many snowmobile trips also have a groomed or well-established trail in the valley bottom, leading to a cabin or common start point for the day.
These access trails to cabins or common start points were given an overall rating. Then sub-areas were identified, where sledders branch off from the main trail. These sub-areas, generally defined by major terrain features, were then given an overall rating which might differ from the rating given to the access trail. This scheme allows people to assess risk for relatively simple trail riding separately from the risks associated with the subareas, which often include narrower side valleys, higher elevations, or more exposed terrain.
Developing the data for both skiing and sledding included reviewing the trip lists for each region with locals, obtaining basic geographic data (map sheet information, UTM coordinates, access points, etc.) and, of course, assessing an ATES rating for each trip. Clearly not every ski and snowmobile trip was included in this project. We attempted to get trips that are representative of the most-used areas of BC and Alberta but are very aware that much remains to be done. Over time, it is hoped that all trips everywhere will be rated and that resources, such as guidebooks, will include ATES ratings for trips they describe. This way, the ATES ratings will eventually come into general use by recreational backcountry users.
The ATES ratings work done to date will make the Avaluator a useful tool for backcountry recreationists in the coming season. As the task of rating trips continues in the future, the Avaluator will become increasingly effective for more users in more places.
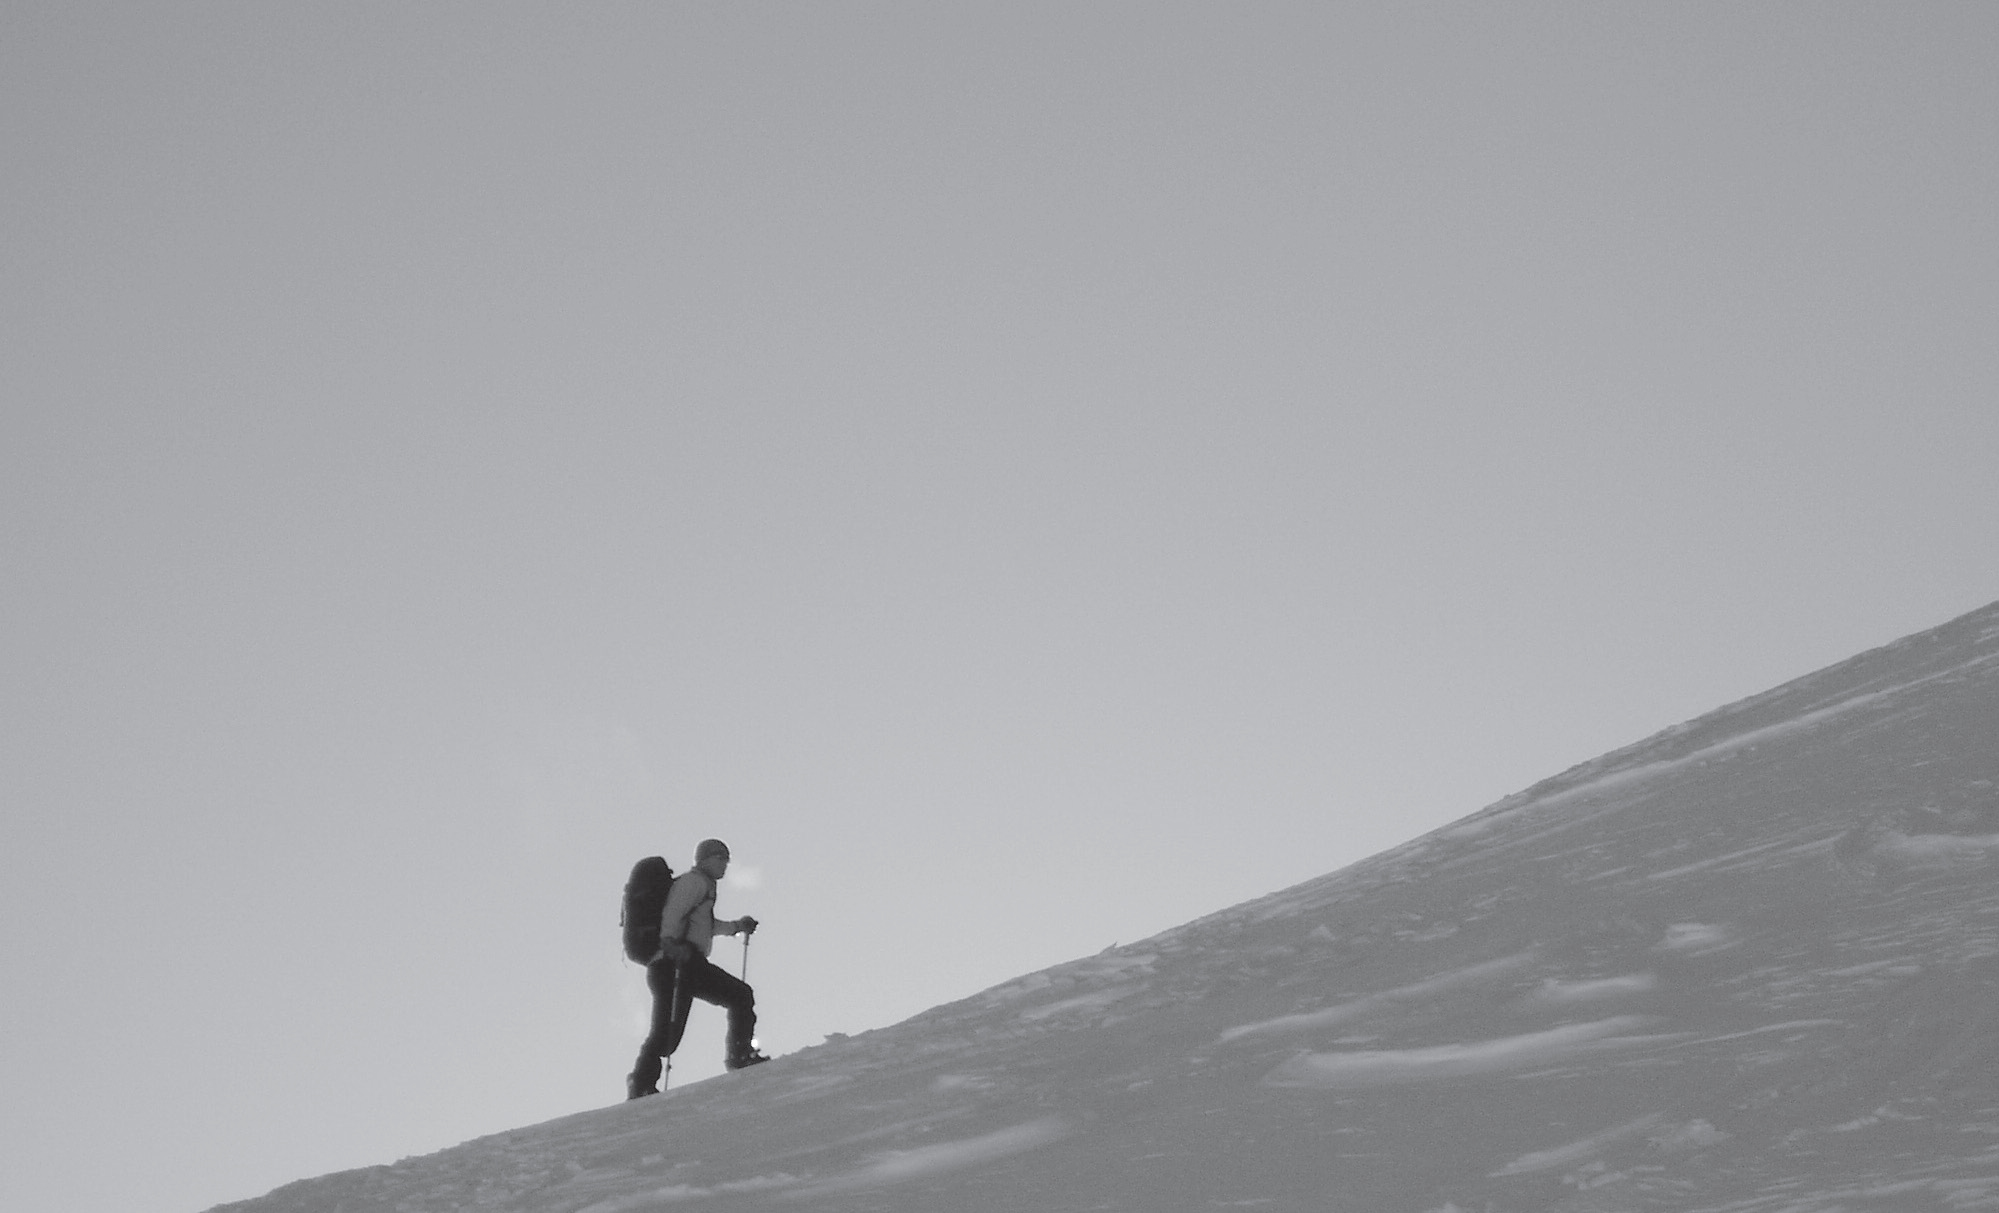
PHOTO: GRANT STATHAM
HOW DID PARKS CANADA DO IT?
The Avalanche Terrain Exposure Scale originated in Parks Canada. Grant Statham, Parks Canada’s Avalanche Risk Specialist, came up with the concept and together with Bruce McMahon, Senior Avalanche Technician at Rogers Pass, they steered the project through numerous consultations. The actual process of rating terrain began in August 2004.
By November of that year 275 ski touring trips in the mountain parks had been rated and the information published. The next summer waterfall climbing was tackled. By November 2005, 75 ice climbs in the national parks had been rated and published. Grant Statham is quick to point out the obvious advantages his team had in rating terrain in the parks.
“To start with,” he explains, “we have an amazing base of knowledge to draw from. We have numerous mountain guides in every park, some of whom have been there for decades. People like Gord Irwin, Marc Ledwidge, Brad White, they know every avalanche path in Banff Park. And there are people like them in every mountain park. It made the terrain discussions so much easier than what the CAC is going through now. Really, there is no substitute for local expertise.”
Tags:
ates
avalanche canada
avalanche terrain exposure scale
avaluator
grant statham
greg johnson
karl klassen
parks canada
Permalink
| Comments (0)
|
|
|
Posted By Alex Cooper, Canadian Avalanche Association,
March 25, 2020
|
From volume 91, winter 2009-10
By Manuel Genswein
1.INTRODUCTION
A variation of companion rescue is performed by clients of commercial guiding, off-piste and helicopter skiing organizations. The experience level of non-commercial back-country users is typically similar and their training level has primarily been achieved by their own motivation and sense of responsibility. Hence during an accident the level of competence amongst buried and non buried subjects is similar. In contrast, the level of responsibility, preparedness and training between clients and guides in commercial operations are hugely different.
By emphasizing “Safety,” some commercial operators create expectations that are difficult to fulfil in the context of ski touring, heliskiing or off-piste skiing. This does not help the clients’ mental preparedness for an accident. The motivation to train their clients is partly due to their own interest and partly due to laws concerning product liability. In countries with harsher product liability laws the training of clients is implemented more thorough than in countries where those laws barely exist. Another interesting fact is the diverging opinion among guides as to the usefulness of training their clients.
Some guides highly value a good base education also for their own good in order to be rescued. Others just hang an avalanche transceiver around the neck of their clients and have resigned themselves to never having a hope of being rescued by them. Because of the hopeless attitude of the latter group, typically their clients don’t get equipped with probe and shovel, which makes a rescue basically impossible. The combination of probe, shovel and transceiver—called “personal rescue equipment”—forms the base of an efficient rescue. This holds true even for commercial backcountry operators. In this context, the potentially rapid availability of rescue equipment—e.g. Helicopter aided companion rescue by heliski companies—is not enough of an excuse to fail in outfitting each client with their individual personal rescue equipment.
The topic of training and equipping clients appears especially important, if one considers that statistically it is the first person to enter a slope, that has clearly a higher probability to release an avalanche than subsequent persons.
2. HOW MUCH TRAINING IS REALISTIC AND ADEQUATE
Central to this discussion is the amount of time needed to adequately train the clients. The threshold for clients and guides is rather low compared to non-commercial groups, where education is a substantial part of the work for a guide.
After extensive enquiries with many commercial guiding, off-piste and helicopter skiing organizations (daily and weekly operators) in regards to an “acceptable” amount of time allocated for client training, the choice for an adequate and practicably possible time frame was 15 minutes. For those operators who have always valued fundamental training, this may appear quite short. For those guides that have “just hung the transceiver around the clients’ neck,” each minute appears to be too much. Ultimately the 15 minute time frame meets the requirement for “acceptance” and “usefulness.” Especially those who see the situation in a rather pessimistic light might put a little more importance into adequate training and personal rescue equipment for clients once they see the rather convincing test results.
Increasing client training time from 15 to 30 minutes would with great likelihood not significantly increase rescue efficiency. In the additional time no great advantages in search and rescue techniques are achieved. A valuable addition would be a short practice of a rescue scenario. Within the chosen time frame it is possible to learn search/ strategy for multiple burials by applying the “marking” feature.
The goal of this project and the field test is to design a training module for client training. After extensive enquiries with many commercial guiding, off-piste and helicopter skiing organizations (daily and weekly operators), the choice for an adequate and practicably possible time frame was 15 minutes. Immediately after the 15 minute training, the clients were asked to search for and excavate two buried subjects in a 50m x 80 m field. Based on the quantitative results of this test, conclusions as to the efficiency of the training module were made and the subsequent module was changed to optimize the content for the next group.
3. TEST PARTICIPANTS
All participants were clients of guides and ski instructors. For the field test the clients were separated from their guides. 83 clients participated in 14 groups. The clients‘ knowledge was varied; most were beginners. The average age was 53; 17 clients were older than 65. Guides were instructed not to hold any special lessons prior to the test. At the time of the test clients knew each other for a couple of hours up to a couple of days.
4. TEST ENVIRONMENT
4.1 Test fields
For efficient data recording, two test fields were used. They were 50m x 80m (see illustration 1), which represents the median size of “survived recreational avalanches” in Switzerland. Slope inclination was approximately 5 degrees in the lower third and up to 20 degrees in the upper end of the field.
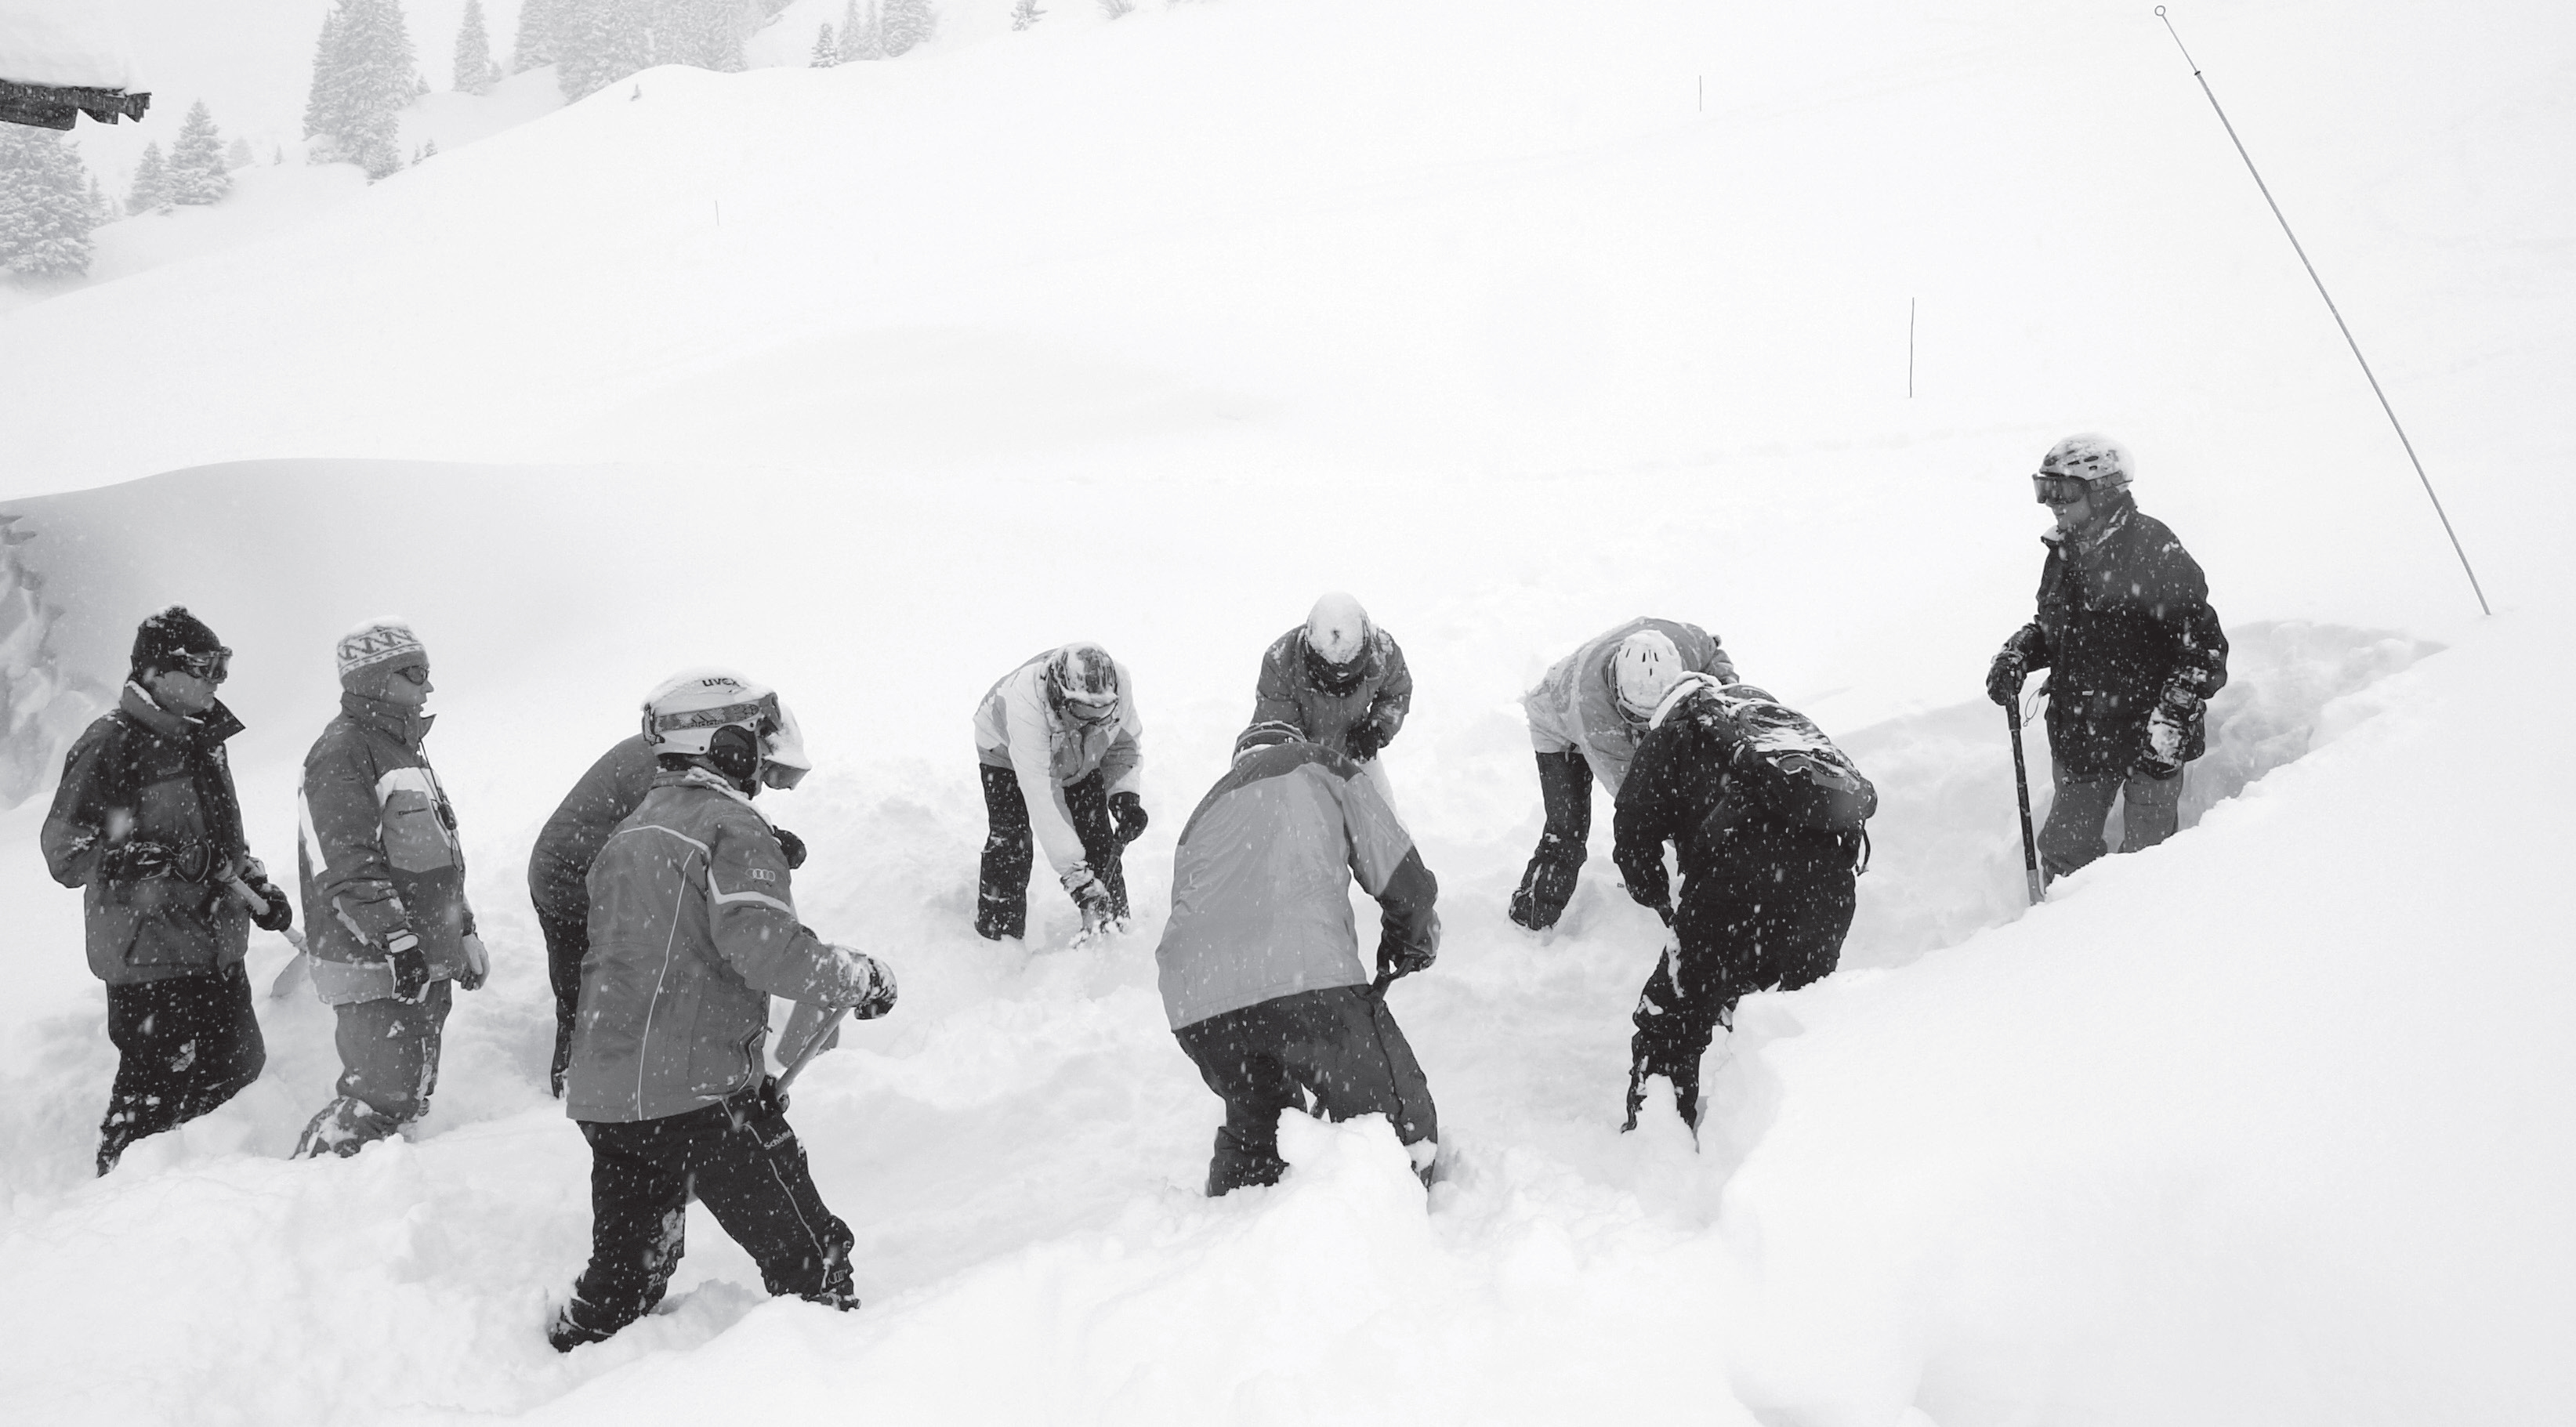
Starting point for all rescuers was always a corner at the bottom end of the field (see illustration 1, triangle). In comparison with a typical off-piste avalanche accident this constitutes a significantly more difficult scenario. During an off-piste accident significantly more than 50 % of all rescues are conducted from the top. Foot penetration was between knee and hip deep. This cost the rescuers a significant amount of time and effort, as they were only allowed to move without skis.
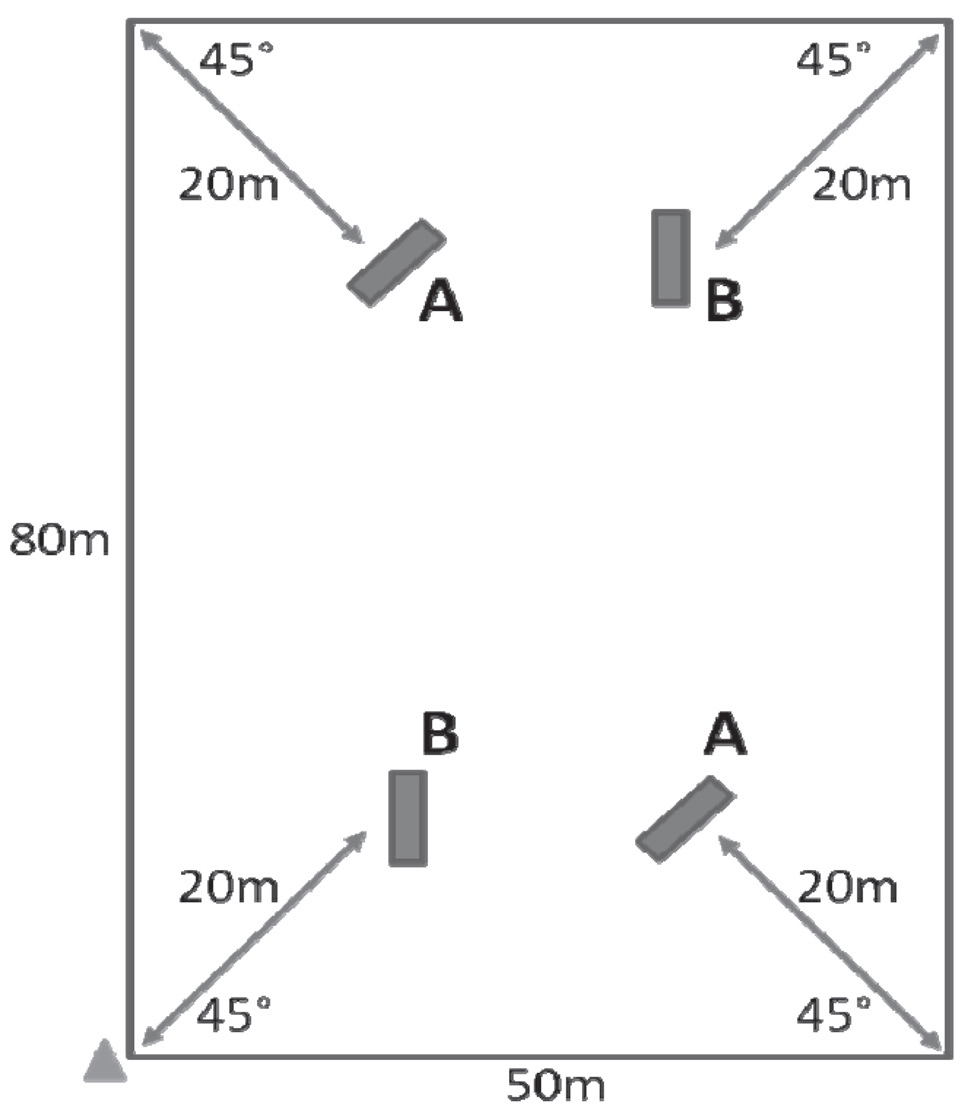
Illustration 1
4.2 Buried Subjects
The “victims” were two bags normally used to carry firewood, sewn together and filled with straw. The approximate size per “victim” was 180cm x 70cm. When burying the victims, the snow was stomped down layer by layer. Burial depth was 50 cm – 100 cm, representing the average burial depth in off-piste avalanche accidents. The buried subjects were equipped with remote control avalanche transceivers with probe detection device. Two buried subjects were activated per search, combination A-A or B-B.
5. TEST PROCEDURE AND DATA RECORDING
All groups were lead to the site by their respective guides. Skis and other non-rescue specific gear was left behind. Guests received adequate probes and shovels. Only three-antenna avalanche transceivers with specific “marking” function to eliminate a previously located signal were used in this test. After the group arrived at the site they received a 15-minute instruction. After the short instruction participants were presented with the rescue scenario.
Details recorded:
● Signal search time: The time until the first signal is received.
● Coarse search time: The time from the first point of reception until the signal decreases for the first time as the rescuer walks over the buried subject.
● Fine search time: The time when a clear minimum of distance (or maximum of volume) can be isolated.
● Pinpoint search time: The time when the rescuer hits the buried subject with a probe.
● First visual contact with the buried subject
● Full body free
6. PRACTICAL TRAINING MODULE
The 15-minute training module included the following content:
● General goal and overview
Search procedure including “airport approach”
Mounting of the probe and shovel
● Basic handling of transceiver
“OFF – SEND – SEARCH.”. Switch SEND fg SEARCH two or three times on command, all together, repeat until a routine has been established. Verify after each step, if all participants were able to switched to the appropriate mode.
● Practical search with explanation of each search phase.
Practical search of one buried subject at 35 m distance. Transceiver angled at 45 degrees to group g curved search path, which forces attention on direction indication on transceiver. Flux lines / flux line characteristics not discussed. Clients follow with their transceiver on receive. Group is halted before next search phase to explain the next steps.
● Signal search
If distance to buried subject is greater than range of transceiver g signal search, as per diagram on back of transceiver, is necessary. 3D rotation until signal is detected. Move – no life has yet been saved by just standing still!
● Coarse search
Hold device horizontally “move in direction of arrow.” Does distance indication decrease or increase? At distance 10: airport in sight g slow down!
● Fine search
Approach g slowly and precisely, holding transceiver close to snow surface. Absolutely no grid search! Place shovel at the point of smallest distance indication.
● Pinpoint search with spiral probing (4) up until the “hit” at approximately 1.5 m burial depth. Leave probe in snow. “Mark” with marking function on transceiver; wait until all clients have marked. Activate second transceiver in 15m distance. All guest will locate the second transceiver on their own.
● Excavation
Short explanation of V-shaped snow conveyor. Put clients in V formation while teaching basic concept—“cut blocks” and central snow conveyor belt, paddling motion and correct handling of the avalanche shovel. Actively running of conveyor belt. Explanations and corrections while the clients work. Let conveyor belt run for 3 – 4 min. Practice rotation on command, no specific instructions as to behaviour when first contact with buried subject.
7. RESULTS
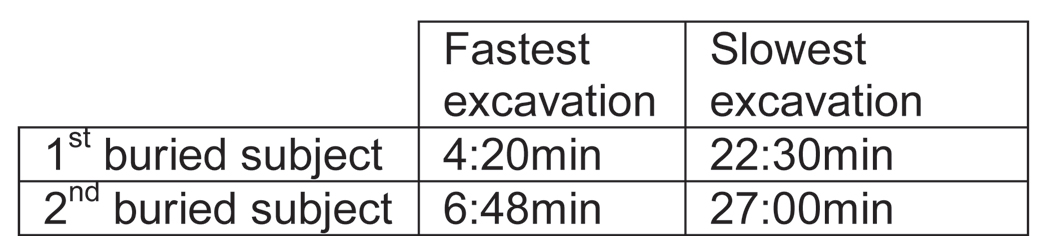
14 groups of 83 clients reached the following median times for locating and completely excavating the buried subjects. Fastest and slowest times were measured as follows: The biggest time lag resulted between the completed excavation of the first buried subject and the start of the fine search for the second buried subject. Those rescuers who did not locate and mark the first buried subject themselves confessed often great difficulty in physically removing themselves from the first buried subject and moving towards the second buried subject, as the distance indication on their transceiver increased.
8. DISCUSSION AND CONCLUSIONS
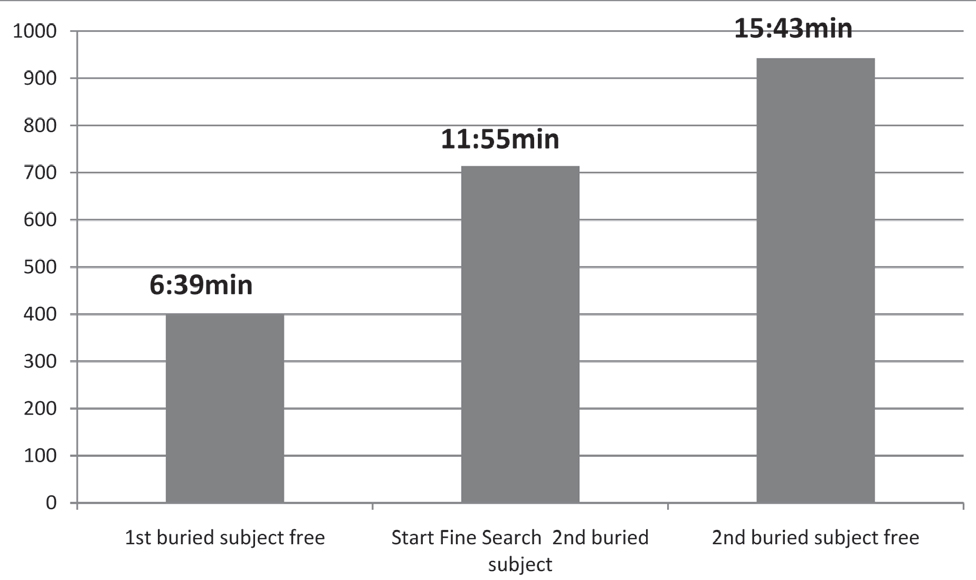
The field test results prove that very realistic survival chances exist within a commercially guided group if the guide is buried. The surprisingly short search times make it clear that short and efficient guest training makes sense. The common opinion that a guest cannot ensure the survival of the guide is hereby not accurate and has clearly been proven wrong.
Despite the short training time, the second buried subject was located and excavated in all scenarios. Clearly this result can be attributed to the technically advanced transceivers with marking function. Problems arose for the rescuers who did not mark the first buried subject while transitioning to locate the second buried subject. Those problems indicate that transceivers could further be improved. A basic requirement to achieve the above results is to always outfit clients with modern rescue equipment—probe, shovel and transceiver with “marking” function. The author recommends that instructors use the guidelines and techniques outlined in this paper when training their clients.
The full paper may be downloaded at www.genswein.com
Tags:
companion rescue
manuel genswein
rescue
ski guiding
Permalink
| Comments (0)
|
|
|
Posted By Alex Cooper, Canadian Avalanche Association,
March 18, 2020
|
From volume 100, spring 2012
Story and photo by Wren McElroy
“NUMEROUS AND LARGE AVALANCHES IN THE WINTER OF 1971-72 STIMULATED A GROWING INTEREST IN AVALANCHE SAFETY EDUCATION.” – PETER SCHEARER
DID BEING BORN IN 1972 HELP SHAPE MY PASSION FOR AVALANCHE EDUCATION?

OVER THE PAST three years, that passion has helped bring John Tweedy’s vision of using the old highway crew camp at Kootenay Pass as a base for avalanche education to fruition. The combination of easy access to terrain and exposure to an active MOT avalanche control program make the base camp an ideal location for learning. Tweedy was the BC Ministry of Transportation’s first avalanche technician at Kootenay Pass, starting in 1980 and retiring in 2010.
Construction of the highway between Salmo and Creston was begun in the late 1950s; it was opened with ceremony in August 1964. The highway ran right through many kilometres of avalanche paths on both the east and west side of Kootenay Pass. Crews were surprised by the amount of snow on the south facing slopes when they resumed work in the spring—avalanche debris stopped the plow truck drivers from reaching the pass. The original camp for the maintenance crew, equipment operators, plow truck drivers and avalanche technicians was set up in the early 1970s at 1,775m. During a particularly heavy storm cycle, assistant avalanche technician Dave Smith’s truck was buried in the yard, and then run over by a plow. He hitchhiked home.
Early Kootenay Pass professional avalanche courses started in 1979 and ran until 1991, based out of a Creston hotel. A nearby Greek restaurant even created an official training school libation called “the avalanche.” Courses offered included the RTAM Level 1 and Level 2 (Resource Transportation Avalanche Management) and CAA Avalanche Operations Level 1 and 2. During 1981-82, four fully supported manual weather stations were put in place, provided by MOT for the Creston-based courses.
Eventually, the daily 120km drive from Creston proved to be too much and courses at the pass began to wane. Furthermore, the highway maintenance was transferred to a contractor who did not maintain the course snow study plots at the Kootenay Pass summit. Another attempt to hold a Level 1 course at Kootenay Pass was made in the late 1990s, and John Buffery and Marc Deschênes drove from Nelson with students. Days at Kootenay Pass were interspersed with trips to Whitewater, but it was still too much driving.
In 1992, a new building named the Bunkhouse was built, which was a welcome relief from the ATCO trailers that populated the pass. MOT and the road and bridge maintenance contractor manned the building until 2005. When the maintenance contractor started plowing out of Creston, the need for a manned camp at the pass dissolved.
Laura Adams, a CAA Professional Member teaching the Renewable Resource Program at Selkirk College, signed a memorandum with Parks in 2002 to able to teach in Stagleap Provincial Park, but did not use the building. A number of courses for that program were taught up there. I taught a three-day winter camping/RAC course there in 2003 with Laura’s successor Keyes Lessard. Other Selkirk College AST courses were taught there throughout the 2000s, including a course Keyes and I taught for the Department of National Defense. I used the building to teach an all-women AST 2 course I in 2005, and benefitted from a presentation and mock avalanche scenario by Ministry of Transportation. In 2006 and 2008, the RCMP and the Mountain National Park Dog Handlers used the Bunkhouse for Dog Handler Validation courses, which did not seem to impact the day-to-day operations of the avalanche program.
At that time, BC Parks weighed in on the building’s usage. They did not want to see a mountain hostel at the pass; however, they were very supportive of the educational opportunities that could be offered up there. Two BC Parks staff, Dave Heagy, Senior Parks Ranger and Jeff Volp, Area Supervisor, taught AST 1 courses up at the pass for the Ministry of Environment in 2010 and 2011. Participants included Park Rangers and Senior Rangers, Area Supervisors, Conservation Officers, and other Ministry of Environment Staff. All the participants stayed at the Bunkhouse and utilized the classroom, kitchen and living facilities.
In the fall of 2009, John Tweedy and I spoke of starting the CAA Avalanche Operations Level 1 courses again up at the Pass. We agreed on the benefits for the students, instructors and the ITP program to run the courses there. Ian Tomm asked for a proposal. John laughed at the simplicity: the facility is free, the travel is free, it’s all here, he said; bring the students, instructors and a cook and you are good to go. The biggest challenge of a hut-based course is the logistics of the helicopter transport, but at Kootenay Pass, everyone drives there and then they stay. Students and instructors have full days without worrying about driving times, meal preparation or cold students sleeping in the back of trucks. Three years in a row, I missed the first day of teaching a CAA Level 1 course at Kokanee Glacier Cabin because of short December days and difficult weather. At Kootenay Pass, that is not an issue.
In January 2010, students stayed in the Bunkhouse as Course Leader, Mike Rubenstein and I taught the first CAA Level 1. The week was a resounding success, with support from the MOT crew, fantastic catering and good weather. Three Level 1 courses have been run in 2011 and 2012, with positive reviews from all parties involved.
The Bunkhouse can accommodate 13 students, two instructors and a cook, with private rooms and shared washroom facilities. There is a separate kitchen, classroom and inside storage for skis and gear. The MOT avalanche staff maintains a residence as well. A great benefit is the close involvement with the MOT Highways avalanche control program.
A short walk from the building, the Avalanche Technicians have enlarged their existing weather plot; the twice daily weather observations are easy to get to and relevant. Even as we move into the digital age of weather stations, having a professional, manual weather station for students to use adjacent to the Highways weather station certainly enhances the hands-on learning. Anyone can read a digital screen, but to walk out in the cold, dark air of the early morning and read a maximum and minimum thermometer is better for tactile learners.
The elevation of 1,775m is a great starting place for ski tours, and each day progresses further into the terrain. With short travel times, groups are able to get to their study areas, look at terrain and have time to dig their profiles. Some days we were able to travel and dig test profiles on two different aspects. Mid-week we travel to Whitewater Ski Resort, an hour’s drive to the west, where students see another active avalanche program. This provides good linking to lessons—by that point, the students have started using the daily hazard evaluations and drafting snow profiles and they get the opportunity to see all of those skills put into practice. Also, with the easy-access backcountry a short tour from the resort, students are quickly exposed to a different scope of terrain. Whitewater provides one-ride passes for the students and instructors in exchange for ITP credits for Whitewater staff.
Later in the week, Tweedy successor Robb Andersen presents on the MOT avalanche control program. Robb also demonstrates an avalanche rescue scenario with his dog Kilo. A unique benefit to Kootenay Pass is witnessing the Gaz.ex avalanche control in progress. This year we arrived on Sunday, January 29 as a significant storm cycle was occurring. Robb closed the highway at 02:30 in a high hazard. He woke Dave Smith and me up at 05:00 to let us know they were going to do a shoot. Students were in a safe zone on the highway by 05:30 to experience how avalanche hazard is managed and mitigated on the highest all-weather mountain pass in Canada. We could see the flash of the Gaz.ex and hear the rumble of the size 3 and 3.5 avalanches as they buried the highway. Robb’s incredible video footage of control work allowed the students to see the magnitude of what they could hear. The highway remained closed that day until 2:30pm, but the class was secure in the Bunkhouse learning about the nature and formation of avalanches.
Many stakeholders are involved with the operation of the Bunkhouse at Kootenay Pass. BC Parks owns the land, MOT built and owns the building, and the Highways Road and Bridge Maintenance Contractor is responsible for the upkeep of the building. Infrastructure upgrades including potable water, plumbing upgrades and reducing the carbon footprint are in the plans for the coming summer season to allow for continued operation of courses.
Using the Bunkhouse for educational courses is a win-win situation for course participants and the various agencies that take advantage of having their courses at Kootenay Pass.
Tags:
avalanche education
industry training program
kootenay pass
wren mcelroy
Permalink
| Comments (0)
|
|
|
Posted By Alex Cooper, Canadian Avalanche Association,
March 11, 2020
|
From vol. 85, summer 2008
By Matt Macdonald and Mindy Brugman, Operational Meteorologists at the Pacific Storm Prediction Center, Environment Canada
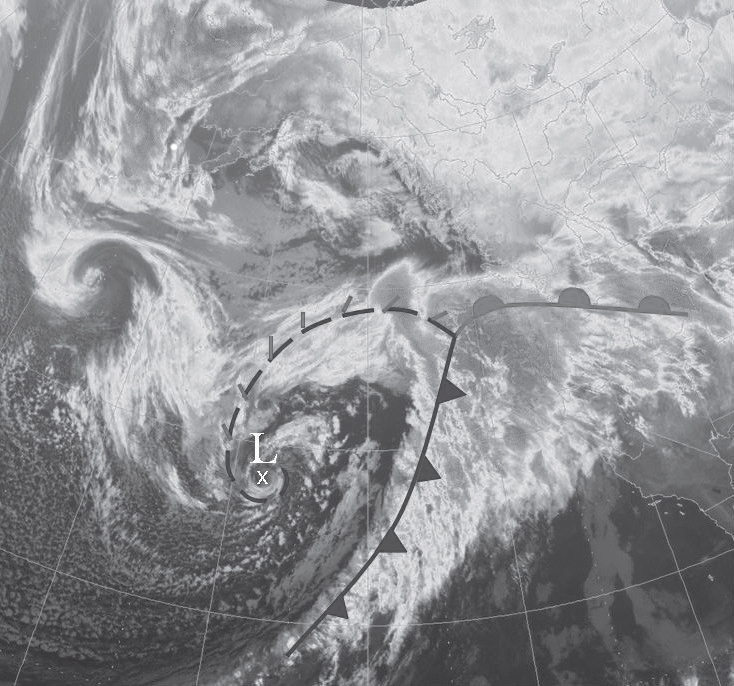
Figure 1: Infra Red satellite image with superimposed fronts of the storm reaching the coast of BC on December 3rd, 2007 at 03:30UTC.
The 2007-2008 winter season posed a great challenge to the entire Canadian avalanche industry. A large part of this challenge was attributable to persistent weak layers (PWLs). The three major PWLs were the December 3 facets-on-crust layer and the two surface hoar-on-crust layers from January 26 and February 25. The latter two layers were essentially the product of prolonged ridges of high pressure. From a meteorological perspective, the December 3rd layer was the result of a much more interesting sequence of storms. In Forecasting Snowpack Troublemakers, we take a look at the ingredients of this Pineapple Express-like event, the performances of short and long range numerical weather models as well as recent tools used by the Pacific Storm Prediction Centre (PSPC) for forecasting these types of events.
Let us first define Snowpack Troublemakers. A Snowpack Troublemaker is any disturbance that creates a significant discontinuity in the weather pattern and consequently the snowpack as well, by bringing heavy snow and/ or rain, strong winds, rapid changes in temperatures/freezing levels or prolonged solar radiation/clear nights. It is important to note that it is the speed and intensity at which these elements change that will determine how much trouble the disturbance brings to the snowpack. The December 3 storm was deemed a Snowpack Troublemaker because it met all of these criteria: heavy snow and rain (70cm of snow followed by 25mm of rain in Revelstoke); sustained winds of 100 km/h with gusts up to 150 at many mountain tops; rises of 15oC in 24 hours across much of BC followed by falling temperatures; prolonged sun and clear nights. This sequence of events resulted in a weak layer that persisted throughout the entire season and was linked to many fatalities and several close calls.
Before the influx of moist and mild air typical of a Pineapple Express reached the coast of BC on December 3, an arctic ridge of high pressure centred over the Yukon was in place. This ridge established an arctic flow of cold air across the province and caused the first segment of precipitation to fall as snow. As the upper atmospheric flow switched from northeast to southwest, the overriding warm air sent freezing levels up to 3,000 metres and transformed the falling snow into rain. As the low pressure system stemming from the tropics approached the coast and deepened, winds strengthened from moderate to extreme. When the low hit the coast, heavy snow gave way to torrential rains (Figure 1). Once the low finally moved inland and weakened on December 5, another arctic ridge set up causing the saturated surface to freeze and facets to form subsequently.
Overall, the evolution of the December 3 storm was well handled by numerical weather models. Both the Canadian GEM and American GFS models hinted at the Pineapple Express event four to five days out. This convergence of guidance provided forecasters with a high level of confidence which in turn allowed us to convey the importance of the high impact weather event on the horizon. In recent years, Ensemble Forecasting Systems have become a mainstay tool for the operational meteorologist. These systems are comprised of multiple numerical models and are left to run out into the 10 to 14 day period. The mean of the ensemble members has proven to deliver a more accurate long range forecast than individual model runs. Both the Canadian and the North American Ensemble Forecasting systems did a great job at signaling the characteristics of a Pineapple Express event as early as 12 days prior to the storm striking (Figure 2). Ensembles are hence of great utility for long range outlooks and are being increasingly incorporated into the forecast process.
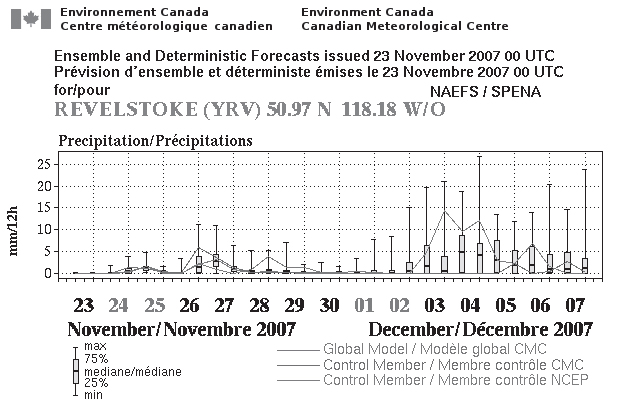
Figure 2: North American Ensemble forecast for Revelstoke issued on November 23rd, 2007, 11 days before the event. Notice the forecasted amounts of 15 to 20 mm per 12 hour period on the day the storm hit.
Another variable that forecasters at the PSPC have been incorporating into their analysis and prognosis is the Madden Julian Oscillation. The MJO is a tropical disturbance that propagates eastward along the equator in a wave like fashion. Its signal is monitored by surveying the outgoing longwave radiation along the equatorial Indian and Pacific oceans. Essentially, this means keeping an eye on convective activity as well as tropical cyclones. The second essential element to be surveyed is wind anomalies at 200hpa as they are responsible for the development of these storms and potentially delivering the surplus of heat and moisture to mid-latitudes. A significant correlation between the activity of the MJO and the storminess in the Pacific Northwest has been observed throughout the past decade. Thus, there has been increased research and development in forecasting the MJO. The Australian Bureau of Meteorology has created a “spider plot” to conceptualize the position and strength of the MJO. The spider plot has proven to be an excellent tool in monitoring and forecasting the potential of Pineapple Express events such as the December 3 storm.
The short term forecast period remains the primary focus of the Pacific Storm Prediction Centre’s alpine forecast. However, as time permits, long range forecasting tools such as Ensembles and the MJO spider plot will be incorporated to provide avalanche industry professionals with more accurate long range forecasts. As more tools get developed and are verified on an operational basis, forecast lead times for significant weather events such as Snowpack Troublemakers will grow and should help the avalanche industry prepare for storms similar to the one on December 3.
Tags:
matt macdonald
mindy brugman
weather
weather forecasts
Permalink
| Comments (0)
|
|
|
Posted By Alex Cooper, Canadian Avalanche Association,
March 4, 2020
|
From vol. 119, winter 2018-19
By Laura Maguire and Jesse Percival

WITH UNCOMMON SNOWPACKS BECOMING INCREASINGLY COMMON, PRACTITIONERS IN A COASTAL SNOWPACK HAVE BEGUN DEPLOYING NEW STRATEGIES // JESSE PERCIVAL
COGNITIVE SYSTEMS ENGINEERING (CSE) demonstrates how expert practitioners in high risk/high consequence domains make sense of risk in dynamic, ambiguous and changing conditions. Expert performance is identified as going beyond qualifications to include the ability to activate, organize and flexibly apply knowledge (Woods et al, 2010) in time pressured, goal conflicted and uncertain conditions. To do so involves cognitive work.
Using methods from CSE, this study assessed the operational aspects of snow safety then analyzed the artifacts (tools such as worksheets, websites, whiteboards, InfoEx, etc.) that shape cognition and collaboration. Semi-structured interviews were used to detail how tools are used to make and update forecasts over time. Finally, we elicited examples of surprise, near misses and actual incidents to calibrate findings.
Three prominent, interconnected themes emerged from the research:
- Much of the cognitive work is not described in the explicit protocols. The formal representations of what constitutes good practice in forecasting is a small fraction of the strategies experts use.
- The cognitive effort required to manage avalanche risk is a near continuous activity. Forecasting appears to require ongoing calibration. Disruptions to this calibration process have adverse effects on performance.
- Forecasting is a distributed cognitive task across individuals, teams and the broader industry. Successful forecasting requires distributed practitioners of local team members as well as the resources and insights produced by others within the industry.
PREPARATIONS FOR FORECASTING
Formally, the protocols for a forecaster on duty (FOD) suggests producing a control plan shortly after arriving onsite - but each forecaster interviewed detailed extensive preparations that were not captured by the formal description. A variety of work-related techniques were described. For example, time spent carpooling is used as an informal handoff from one FOD to another to discuss recent activity or control measures. This suggests that formulating the day’s forecast begins well in advance so that a forecaster arrives for duty with a hypothesis of how recent changes in conditions affect their avalanche terrain management.
Shared, off the books activity is a common (and likely necessary) practice not explicitly noted in work procedures and demonstrates a need for ongoing calibration – an example that supports all three findings. It is well documented that forecasting takes place under time pressure. By seeking out data that can help them anticipate conditions in advance, the FOD relieves some of this pressure to lessen the cognitive demands required once they officially clock in.
DISRUPTION, ADAPTATION & SURPRISE
A second example: An unexpected in-bounds release. On this day, the forecasting plan had anticipated instabilities due to temperature changes. After control work, it was expected that normal monitoring would identify if a closure was necessary. However, a personal emergency meant the team was operating one person short. Concurrently, a first aid emergency tied up members who would otherwise be monitoring avalanche terrain. This left the FOD ‘in the bump’ for longer than the usual rotation and his normal practice was interrupted. As expected, the temperature fluctuated and a skier-triggered release occurred in one of the avalanche zones.
This example is informative in two ways. Firstly, it is reflective of what “normal work” is – constantly adjusting to workload demands or unavailability of resources and adapting practices to respond to conditions while balancing inevitable trade-offs. Secondly, this example provides evidence that practitioners construct mental models (Adams, 2005) and continually update them.
MENTAL MODELS
The model is an internal representation of current hazards and an expectation of how this may change over time. Mental models are used to retrieve technical knowledge and to flexibly apply it to variable situations.
In constantly changing conditions, mental models become stale unless continually updated. Referring to the in-bounds avalanche example, the model became insufficient after only a few hours. In the previous example, the forecaster coming back from time off is aware their model is stale and seeks information to recalibrate. LaChapelle (1980) notes a “...prevalent and strong reluctance of working forecasters to experience an interruption in their winter routine…” (pg. 78).
This finding emphasizes organizing work schedules to protect forecasters’ daily and seasonal monitoring routine from interruptions or building in mechanisms to support rapid recalibration or redundancy by cross-checking across other team members.
THE BIG PICTURE - MOUNT WASHINGTON // COLE RAMSHAW
DISTRIBUTED COGNITIVE EFFORTS
Notable as well, is the role of a distributed network in constructing mental models. A diverse range of perspectives informed by different experiences, knowledge and mindsets is needed for accuracy. In the resort, the schedule for FOD’s is designed to provide an overlap day to accommodate the need for distributed cognition. This is an explicit recognition of both ensuring currency of the mental model and the importance of interactions between practitioners. Updating provides an opportunity to draw attention to details and to generate shared insights.
Spatial and temporal constraints also require distributed cognitive efforts. Large terrain and limited daylight hours create time pressures. The FOD relies on technicians to gather and relay data effi ciently and accurately. Without the team, the FOD’s mental model can only partially represent actual conditions.
CONCLUSIONS
Errors by normally high performing experts are insights into how the cognitive demands may become temporarily overwhelming. Studies like this illustrate what aspects of practice should be protected from the pressures of ‘faster, better, cheaper’ common in many workplaces and allows for better engineering of the tools, technologies and protocols used.
Further research can provide an empirical basis for: designing decision support tools; developing training; orchestration & distribution of tasks; funding critical resources; and developing new forms of coordination across networks. Identifying cognitive work in different forecasting settings (mechanized skiing, transportation, industrial) is likely to be useful for accident prevention. In addition, CSE studies comparing expert vs recreational cognition is likely to help public safety efforts.
The authors gratefully acknowledge the Avalanche Canada Foundation for their travel support through the ISSW Fund and the Cora Shea Memorial Fund. For the complete proceedings paper or more information about this and other projects in cognitive work of avalanche forecasting contact Laura (maguire.81@osu.edu) or Jesse (jperceival@mountwashington.ca)
REFERENCES
Adams, L. (2005). A systems approach to human factors and expert decision-making within Canadian Avalanche Phenomena. MALT Thesis. Royal Roads University, Victoria, BC, 284.
LaChapelle, E. R. (1980). The fundamental processes in conventional avalanche forecasting. Journal Glaciology, 26(94), 75–84.
Woods, D., Dekker, S., Cook, R., Johannesen, L., Sarter, N. (2010). Behind Human Error. London: CRC Press.
Tags:
avalanche forecasting
cognitive systems engineering
jesse percival
laura maguire
Permalink
| Comments (0)
|
|
|
Posted By Alex Cooper, Canadian Avalanche Association,
February 26, 2020
|
From volume 114, winter 2016-17
Alongside many weather monitoring networks and avalanche specific weather monitoring activities CAA members are aware of is a lesser known provincial snow monitoring program. We caught up the current snow survey program coordinator Tony Litke to ask what the program is about and how it can benefit avalanche professionals.
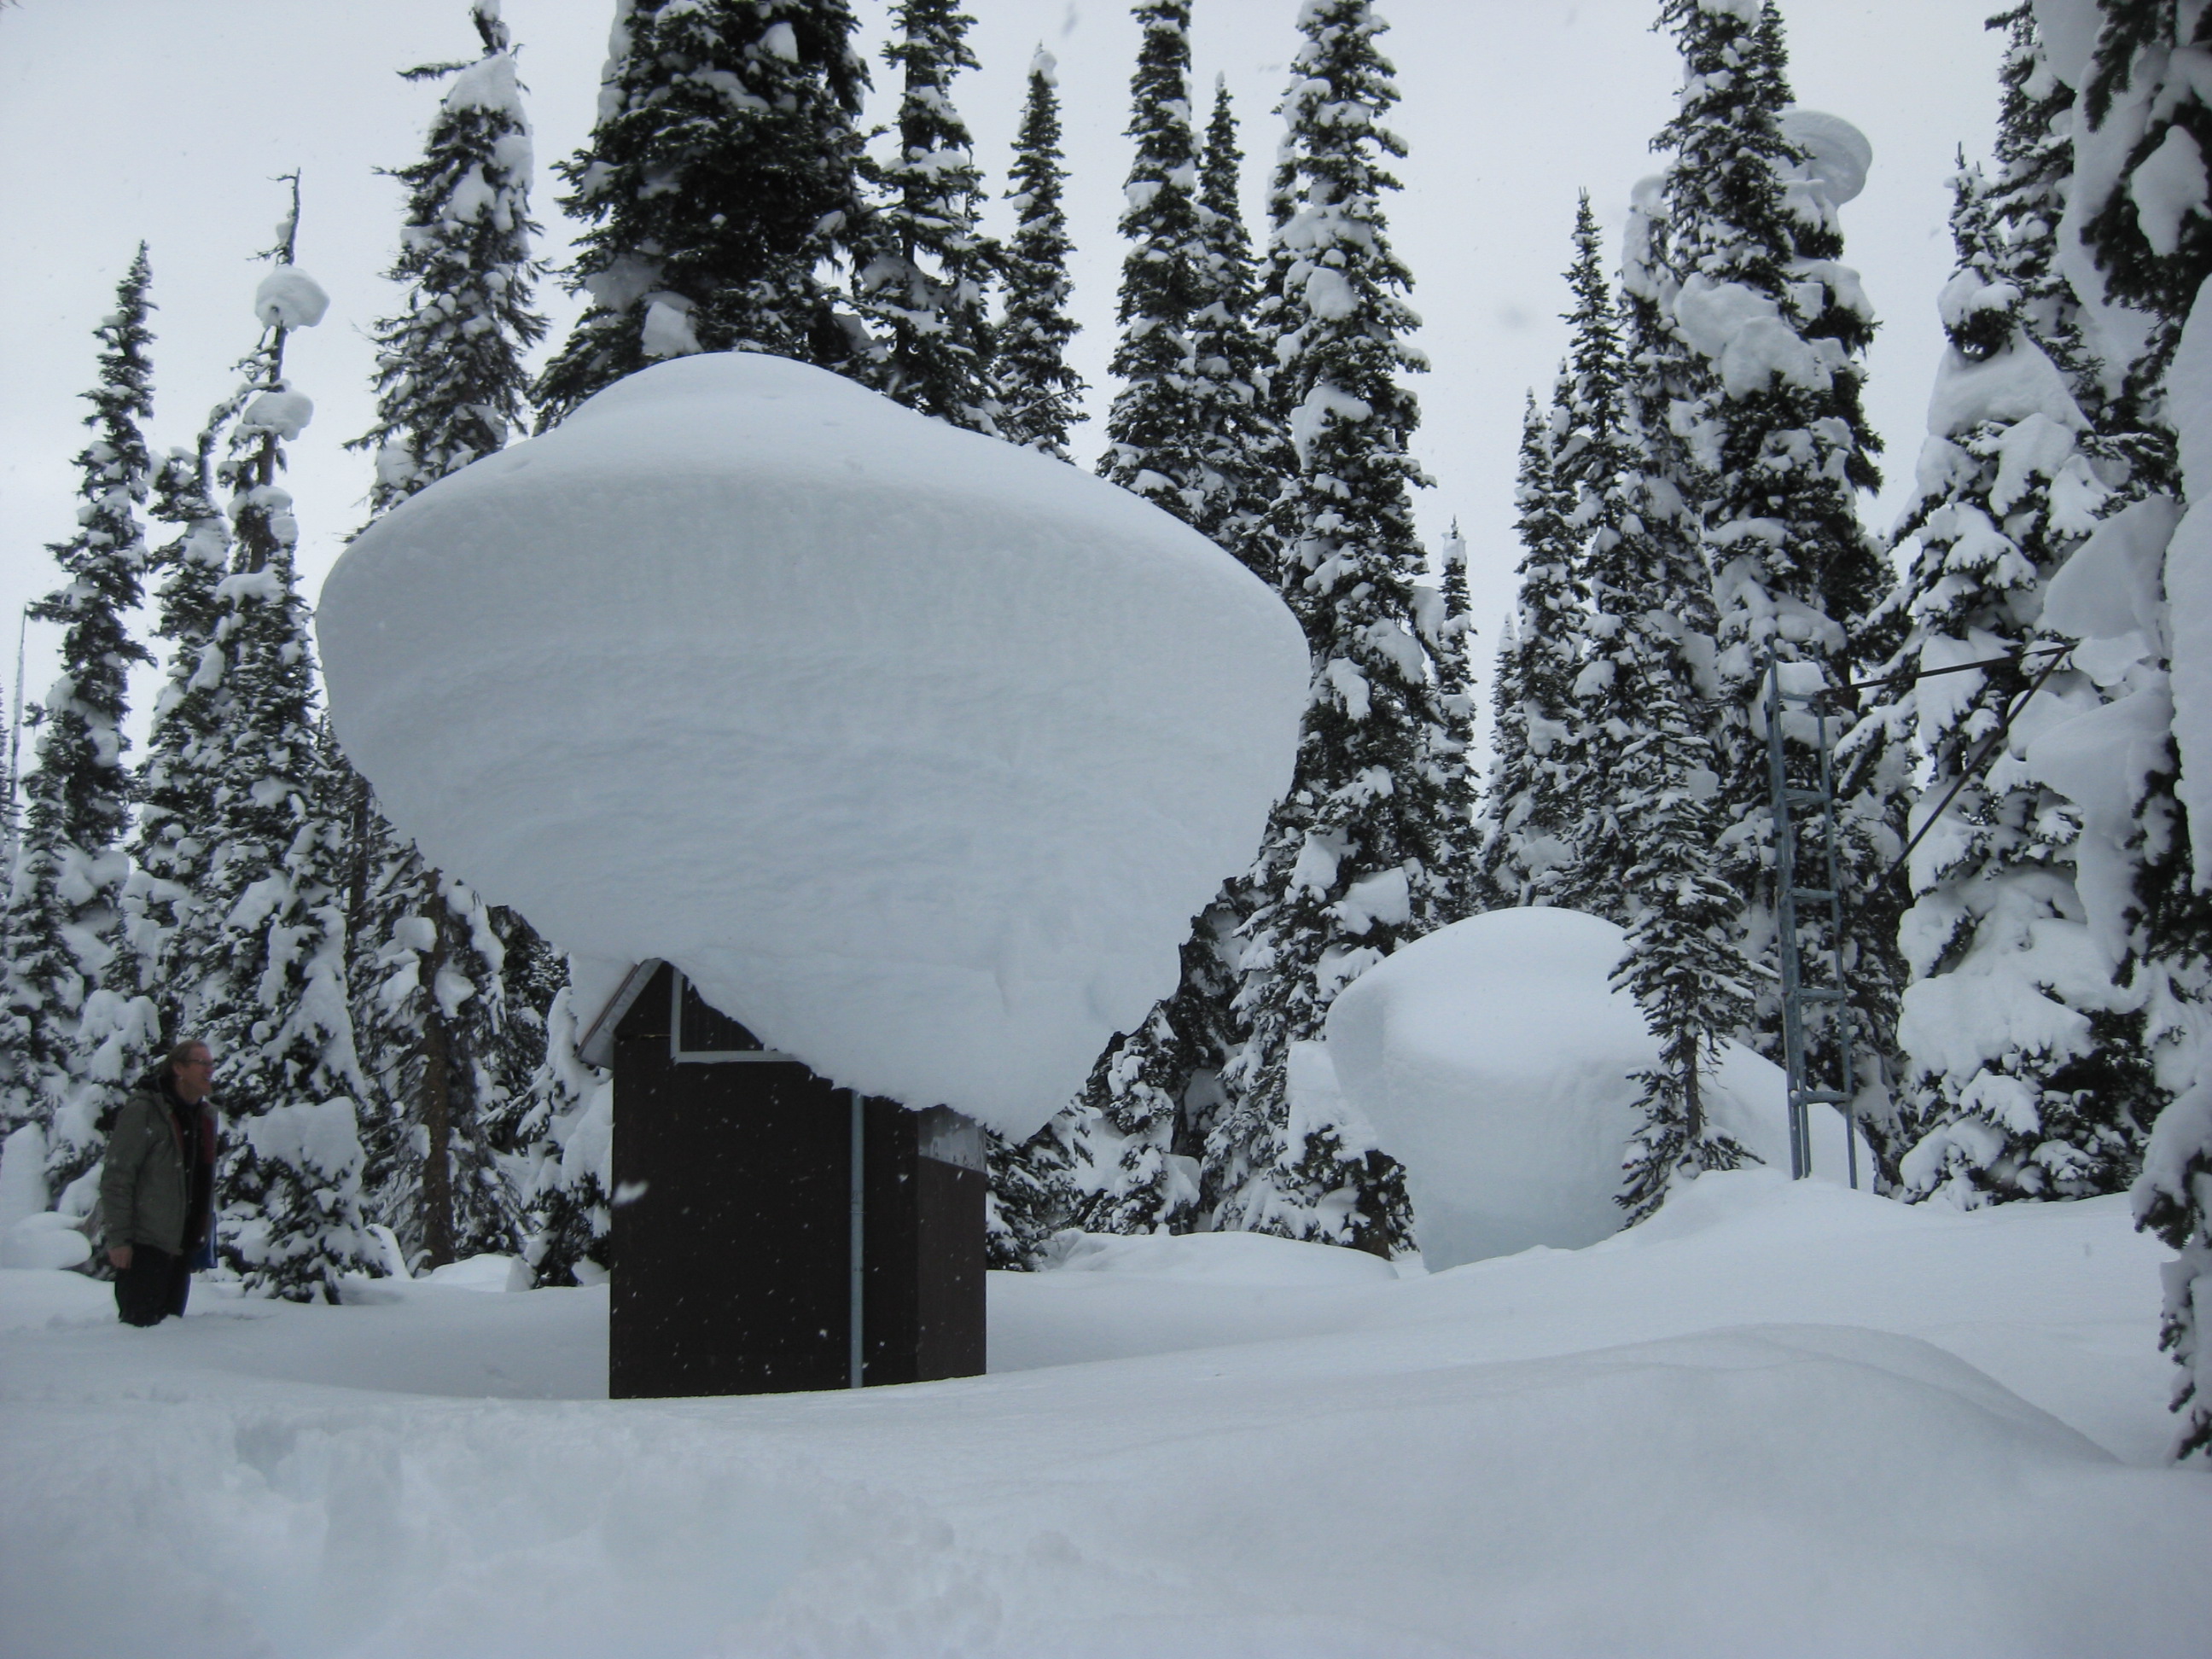
PHOTO: TONY LITKE
TAJ: What is the British Columbia Snow Survey Program (SSP) and how did it come to be?
LITKE: The BC Snow Survey Program was established in 1935 in response to a prolonged drought to monitor snowpacks in BC, and is one of the longest running environmental monitoring programs in the province. It has largely been a cooperative program with federal, provincial and local governments contributing in different capacities over the 80+ years that formal snow surveying has been occurring in BC. Today the major agencies involved are the Ministry of Environment, Ministry of Forests, Lands and Natural Resource Operations and BC Hydro. The program also receives monitoring assistance from some local governments and a few private sector companies.
TAJ: So in a nutshell, what is snow surveying?
LITKE: A snow survey is extremely simple in its nature: a surveyor travels to a site and inserts a specifically designed long aluminum pipe into the snowpack at five to 10 set locations. The pipes are weighed and the average snow depth and snow water equivalent (SWE) recorded. This is performed on predetermined schedules one to eight times per year. Traditionally this data is then correlated to downstream rivers to model and predict water flows and assist with water management.
TAJ: Where are the SSP monitoring sites?
LITKE: Manual snow courses and automated snow weather stations are usually at higher elevation locations, typically between 1,000m and 2,300m. They're found around the entire province from the northern Rockies to the coast to the Kootenays to the Okanagan and everywhere in between. Often they are strategically positioned to correspond with specific drainages and watersheds.
TAJ: How has technology changed the snow survey program?
LITKE: The advent of computers, weather monitoring instrumentation and satellite telemetry has slowly but drastically changed the way we survey snow, starting in 1969 when the first snow pillow and automated data collection platform was installed at Mission Creek near Kelowna. Despite the early start, widespread automation of manual snow survey sites really didn’t really gather momentum until the mid-90s and has been ongoing ever since. Nowadays most automated sites measure and report temperature, cumulative precipitation, snow depth and snow water equivalent on hourly intervals, 24 hours a day, 365 days a year. The most recent development has been the emergence of snow scales as a viable alternative to fluid filled snow pillows, which has made construction and deployment of new
sites far less cumbersome.
TAJ: What are some problems involved with trying to keep track of how much snow there is across BC?
LITKE: Where to begin! I always tell people snow surveys are the hardest simple thing you will ever do. First of all, as we all know snow packs can be extremely variable over very small geographic areas. With manual surveys, human and site specific factors greatly influence the results, and these are extremely hard to control for. Given the remote location of most of the sites you never know what you are going to get until you get there. When it comes to the automated weather stations, lightning, wildfires, snow creep, falling trees, critters, bears and vandalism all conspire to push stations off the air. It’s definitely more challenging than maintaining a weather plot in a resort or roadside setting, because due to their far flung locations we can’t easily visit the sites to see what is going on and often only get to visit them a couple times a year. Thankfully, as time has progressed monitoring technology and reliability have greatly improved to the point where the electronics typically operate problem free.
TAJ: Can you give us a snapshot of the program today?
LITKE: After a few years hiatus there has been a push in recent years to continue to automate manual snow courses resulting in the construction of six new automated snow weather stations this past summer. That brings the total number of automated sites to 76 across the province, in addition to manual snow surveys happening at 158 active sites. This season over one million discrete snow measurements will be recorded across the SSP.
TAJ: How can CAA Members use make use of the SSP data?
LITKE: All the data the snow survey program produces is publicly available, including the historical archives dating back to 1935, and ongoing hourly near-real-time data. Some of the sites are already replicating data into the InfoEx or various other enthusiast-maintained websites. The snow survey program is in the process of creating a new map-based platform to share data that should hopefully go live in early 2017. In the meantime the data is available through the river forecast centers webpage in tabular format at bcrfc.env.gov.bc.ca/data/index.htm.
The snow weather stations all broadcast hourly data, so it is useful for any sort of weather reconnaissance you might need, from determining how a weather system moved through a mountain range to whether or not there is some fresh powder at your favorite touring haunt. We receive all sorts of enquiries from around the world, from power traders in the states betting on the markets that depend on water supply, to the strangest call I remember which was an RCMP detachment looking to find out whether it snowed in a certain area on the day a robbery occurred to aid an investigation. In summer time people are often interested in when the snow has disappeared so they can decide if it is mountain biking season. One advantage of the snow survey program weather station data is that it is year-round, so when the ski hills and backcountry lodges stop updating their websites and submitting to InfoEx, our data keeps rolling in.
TAJ: What does a typical day for you look like?
LITKE: A typical day...is there such a thing? It really depends on the time of year and what is going on. Normally the first thing I do on any given day is take a look at all of the snow weather stations to check that everything is functioning correctly. We aim to visit each site a minimum of twice a year, so a lot of planning and effort goes into those logistics. In the summer once the snow is gone we do all our repair work and any new installations, so depending on the year there might only be a few snow-free months to accomplish a lot of work.
In the winter we like to stop in and make sure everything is functioning like we expect based on what we see on site. I also receive a lot of emails everyday, so I spend a good chunk of my time in the office working with the more than two dozen different cooperating groups that operationally help us deliver the program. My favorite days are the ones in the winter where it’s snowing heavily, time slows down a bit, and everything just seems to be quiet and serene on site. One thing is for sure, every day is different, and every day has a new challenge.
TAJ: Why has this been one of the longest running monitoring programs and how is the data being used for decision making?
LITKE: Water supply forecasting is the primary driver for the program and the impacts range from public safety to economics. From power generation forecasting, flood forecasting, drought monitoring or irrigation planning, decision makers need to know how much snow is in the mountains because it will eventually become water in our lakes and rivers. The more information, and the more accurate the information is, the better the decision making will be. This has been important for decades and will continue to be, which explains why the program has had such a long and healthy life. Of course climate change is another big driver and being able to keep tabs on what is going on in remote mountainous regions over the long term will become more and more important on the horizon There is not yet technology on the horizon that is immediately able to take over in-situ weather monitoring, so it is likely the snow survey program will still be around for some time.
Tags:
snow survey program
tony litke
Permalink
| Comments (0)
|
|
|
Posted By Alex Cooper, Canadian Avalanche Association,
February 19, 2020
|
AN EVIDENCE-BASED GUIDELINE FROM THE INTERNATIONAL COMMISSION FOR MOUNTAIN EMERGENCY MEDICINE (ICAR MEDCOM)
From vol. 103, spring 2013
By Jeff Boyd (a,b), Hermann Brugger (b,c), Fidel Elsensohn (b), and Peter Paal (b,d)
a) Department of Emergency Medicine, Mineral Springs Hospital, Banff, AB, Canada; International Federation of Mountain Guides
b) International Commission for Mountain Emergency Medicine ICAR MEDCOM
c) Institute of Mountain Emergency Medicine, EURAC Research, Drususallee 1, I-39100 Bozen/Bolzano, Italy
d) Department of Anaesthesiology and Critical Care Medicine, Innsbruck Medical University, Anichstrasse 35, A-6020 Innsbruck, Austria

AIRWAY PATENCY. IN BURIALS LONGER THAN 35 MINUTES, THE PATENCY OF A VICTIM'S AIRWAY BECOMES A CRITICAL OBSERVATION. IF THE AIRWAY IS PATENT THE VICTIM MAY SURVIVE, EVEN IF THEY ARE IN CARDIAC ARREST DUE TO HYPOTHERMIA. // HERMANN BRUGGER ARCHIVES
BACKGROUND
Medical management recommendations (Brugger et al., 2004; Brugger and ICAR1, 2006) have been previously based on concepts extrapolated from the avalanche survival curve derived from biostatistical analysis (Falk et al., 1994). A recent study comparing Canadian to Swiss survival produced similar sigmoidal-shaped curves (Fig. 1)(Haegeli et al. 2011).
The initial “survival phase” was shorter in western Canada due to greater mortality from trauma. Thereafter, survival plummeted in both series during the asphyxia phase, ending at 35 minutes burial, with mortality greater in Canada due to denser snow.
Deducing that victims unable to breathe had succumbed to asphyxia at the end of this 35 minutes, while those with a patent airway and an air space could survive longer until death from hypothermia at 90 minutes, the International Commission for Mountain Emergency Medicine (ICAR MEDCOM) published resuscitation recommendations and a management algorithm (Brugger et al., 2001).
However, this analysis did not consider actual clinical experience. The first systematic review of clinical evidence for these recommendations confirmed that duration of burial, airway patency, core temperature and serum potassium levels were reliable predictors of survival (Boyd et al., 2010) and, after expert review by the International Liaison Committee for Resuscitation (ILCOR), were included in the 2010 BLS and ALS2 Resuscitation Guidelines for North America and Europe (Soar et al., 2010; Vanden Hoek et al., 2010).
Although current adoption of these recommendations approximates 75%, there are substantial failures, notably in initiation or withholding of CPR and triage to extracorporeal circulation rewarming (heart-lung bypass) (ECR) (Brugger, 2011). Additionally, recent research in avalanche trauma (Hohlrieder et al., 2007; Boyd et al., 2009), survival analysis (Haegeli et al., 2011) and hypothermia management (Brown et al., 2012) has shifted emphasis.
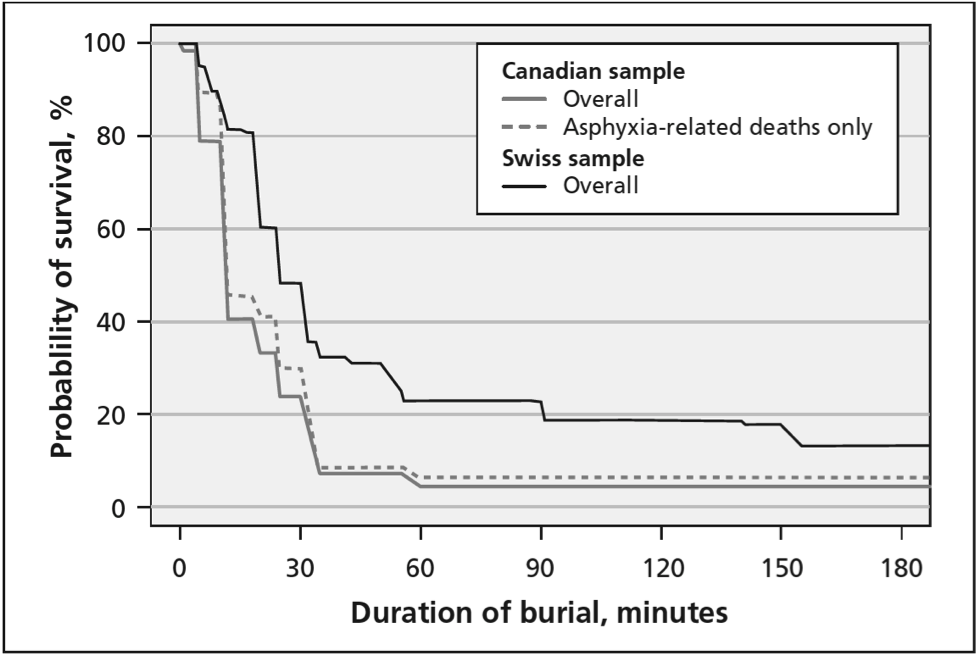
FIG. 1: OVERALL SURVIVAL CURVES FOR PEOPLE COMPLETELY BURIED IN AVALANCHES IN CANADA (N = 301) AND SWITZERLAND (N = 946) FROM OCT. 1, 1980, TO SEPT. 30, 2005, BY DURATION OF BURIAL (DUMBGEN COMPARISON: P = 0.001). THE DOTTED LINE REPRESENTS THE CANADIAN SURVIVAL CURVE INCLUDING ONLY ASPHYXIA-RELATED DEATHS (N = 255). EXTRACTED FROM HAEGELI ET AL., 2011.
METHODS
A structured clinical-literature review of the components of the 2001 algorithm was performed using an ILCOR worksheet format after establishing subject matter, objectives and inclusion/exclusion criteria a priori at a TOPIC meeting of the ICAR MEDCOM. This format examined each of 27 components using individual PICO (population, intervention, comparator, outcome) questions as well as 10 general questions. Findings were presented by the working group to a SCIENCE meeting of the ICAR MEDCOM for expert debate, and consensus recommendations were developed at a MANUSCRIPT meeting in October 2011.
RESULTS
Keyword- and hand-searching found 3,530 publication citations in the peer-reviewed clinical literature of which 96 articles were scrutinized in detail for content, study design and methodological quality. Thirty-seven recommendations were developed, classified for benefit and a simplified algorithm was developed. These recommendations and an algorithm (Fig. 2) for ALS personnel have been published (Brugger et al., 2012). Below is an abridged text oriented to both BLS and ALS rescuers.
GENERAL RECOMMENDATIONS
Safety and welfare
The safety and welfare of rescuers and all others remain paramount.
Companion and organized rescue
Prompt extrication with initiation of BLS resuscitation remains the priority for companions. Organized rescue is best mobilized early, ideally by helicopter, with rescue-trained emergency physicians or paramedics equipped with critical medical and safety kit, plus dogs with handlers.
Airway patency and air pocket
Rescuers are to dig from the side and, in burials longer than 35 minutes, note whether the airway is patent +/- an air pocket present.
General measures
To mitigate against the common rescue collapse from cardiac arrhythmias, hypothermic victims are best managed gently, with minimal truncal and limb movements, without rough motion or inappropriate chest compressions, and kept in a horizontal position.
Dry insulation includes insulation from the snow surface as well as from continued conductive, convective and radiant heat loss. Assemblies include blankets, padded rescue bags and outer windproof and waterproof reflective foils. Wet clothing may be replaced with dry layers if efficient although adding thick insulation over wet clothing is equally effective and usually more practical (Henriksson et al., 2012).
Field rewarming is principally prevention of further heat loss plus chemical heat packs, although more sophisticated rewarming with specific equipment may be indicated if evacuation is prolonged. Heated humidified inspiratory air or oxygen requires field-usable equipment and does not greatly reduce heat loss but may be indicated in prolonged transports.
Oxygen is indicated for any degree of asphyxia and will reduce the risk of arrhythmias in hypothermia (Danzl, 2012). Pulse oximetry may be unreliable with cold extremities and device malfunction from the cold, bright light and high altitude (Luks and Swenson, 2011).
Monitoring
Victims of significant involvement are best monitored throughout evacuation and ideally from the moment they are exposed. This includes electrocardiographic (ECG) monitoring with an AED or monitor-defibrillator. Core temperature is most reliably measured in the lower oesophagus in victims that have an endotracheal tube (tube in the trachea) in place. A medical thermistor probe is preferable although inexpensive probes from indoor/outdoor thermometers can be sufficiently accurate (Pasquier et al., 2012). Epitympanic (ear drum temperature) probes are accurate if used appropriately (Walpoth et al., 1994). Rectal temperatures provide a reasonable initial temperature (Danzl, 2012) although require undressing the victim and lag during rewarming. Other temperatures are likely unreliable. Clinical staging is unreliable if asphyxia or trauma impairs mentation.
Airway management and ventilation
An unresponsive victim without an advanced airway is best transported in the recovery position with the cervical spine stabilized as well as possible. Airway interventions have low risk of inducing arrhythmias and include oropharyngeal airways as well as advanced airways such as endotracheal intubation or supraglottic airways (such as the laryngeal tube). Advanced airways protect against aspiration of vomitus and allow better victim access and spinal stabilization with the victim supine.
Ventilation is indicated when breathing is inadequate and always with chest compressions in CPR.
Trauma management
Pneumothorax is managed with needle thoracostomy (large-bore needle through the chest wall) or open thoracostomy (hole through the chest wall), ideally in a victim that is ventilated with an advanced airway.
Severe limb bleeding is managed with tourniquets. Other trauma modalities additionally include splinting, wound care, analgesia and antibiotics for open fractures.
Trauma victims are best transported to the medical centre that is most appropriate for their injuries, directly to a dedicated trauma centre3 if severe.

MANAGEMENT SCENARIOS
Alert victim
These are normothermic or mildly hypothermic. After assessment add insulation with or without changing wet clothing and allow active movement that will likely be sufficient to rewarm them. They may ingest warm clear sugar-containing fluids that are not alcoholic or strongly caffeinated so long as they are not likely to require sedation or anaesthesia in less than two hours and not significantly injured. Oral fluids will maintain hydration, especially if evacuation is delayed or prolonged.
If the involvement was clearly not life-threatening, then a decision may be made for them to remain in the field. However, if the involvement was potentially life-threatening they are best evacuated to the nearest emergency department for advanced assessment and observation as delayed complications may occur.
Poorly responsive victim with vital signs
These are asphyxiated +/- moderately or severely hypothermic. They are to be closely monitored, ideally with ECG monitoring as early as possible due to the risk of rescue collapse and arrhythmia. Core temperature will be very useful especially for disposition decisions. All general measures and other management modalities become critical.
Transport to the nearest hospital for advanced assessment, intervention and observation is indicated. If significantly asphyxiated, this would best be a hospital with an ICU. Seriously injured victims are best transported directly to a trauma centre. Hypothermic victims need rewarming with modalities such as the forced-air rewarmers most commonly used in surgical programs. However, if there is evidence of cardiac instability, such as ventricular arrhythmias on the ECG, or if the core temperature is <28°C (less than 28°C) direct transport to a centre4 with advanced extracorporeal rewarming (ECR), such as cardiopulmonary bypass, is preferable due to the risk of cardiac arrest during rewarming.
Victim with no vital signs with burial duration less than 35 minutes
These are asphyxiated and only mildly hypothermic. If lethal trauma is found, such as unsurvivable decapitation or truncal transection, resuscitation is withheld. Otherwise, prompt exposure and extrication with BLS including ventilations, with AED/ECG monitoring and defibrillation if indicated/prompted, +/- ALS are started expediently.
If clinical improvement results from resuscitation or any cardiac rhythm is seen on ECG or an AED prompts defibrillation, then resuscitation should continue to the nearest hospital, ideally with an ICU. If no improvement is found after 20 minutes of resuscitation and only asystole (flat line) has been seen on ECG or an AED does not prompt defibrillation then resuscitation may be terminated in the field (Soar et al., 2010; Vanden Hoek et al., 2010; Paal et al., 2012).
Victim with no vital signs with burial duration more than 35 minutes
These have suffered cardiopulmonary arrest from prolonged asphyxia or hypothermia. If lethal trauma is found or the whole body is frozen, resuscitation is withheld.
If they have an obstructed airway they have arrested from prolonged asphyxia, which after 35 minutes has a very poor prognosis, and resuscitation may be withheld (Soar et al., 2010; Vanden Hoek et al., 2010).
If the airway is patent they may have arrested from prolonged asphyxia with the resultant poor prognosis; but alternatively they may have been able to breathe and the arrest may have been from significant hypothermia and the victim may therefore be salvageable. Therefore, if the core temperature is found >32°C they are principally asphyxiated and a resuscitation attempt may be initiated but terminated if no improvement is noted after 20 minutes and only asystole is seen on the ECG or an AED does not prompt defibrillation. But, if the core temperature is <32°C then arrest may be from hypothermia and resuscitation is continued and the victim is transported preferably to a centre with ECR5. If the duration is not known and understanding that a core temperature of <32°C can only occur after at least 35 minutes of cooling, a core temperature of <32°C may therefore be a surrogate for burial longer than 35 minutes (Boyd et al., 2010; Vanden Hoek et al., 2010).
CPR is not modified for hypothermic arrest victims although a longer check of 60 seconds for vital signs is indicated as pulses may be indistinct. Persistent breathing or movement should prompt “watchful waiting” but if no signs of life are found then CPR is best started and continued. Defibrillation is performed if prompted by AED or indicated by ECG although repetitive defibrillation (over three attempts) may not be successful due to the cold heart being very irritable. ALS medications have only been shown effective in animal studies so judicial use is appropriate (Brown et al., 2012). No intervention is to delay transport of hypothermic arrest victims. Note is made that successful rewarming has resulted in good survivals after prolonged CPR of up to six and a half hours (Brown et al., 2012).
If the duration of burial or the status of the airway is unknown or a prolonged transport to ECR is being considered, then a serum potassium level (K+) at an emergency department, best in the direction of the ECR centre, may assist. If the K+ is <8mmol/L then survival is possible vs. >12mmol/L which is not survivable (Boyd et al., 2010; Soar et al., 2010; Vanden Hoek et al., 2010; Brown et al., 2012). A K+ between 8 and 12mmol/L may assist in a decision made with consideration of all factors.
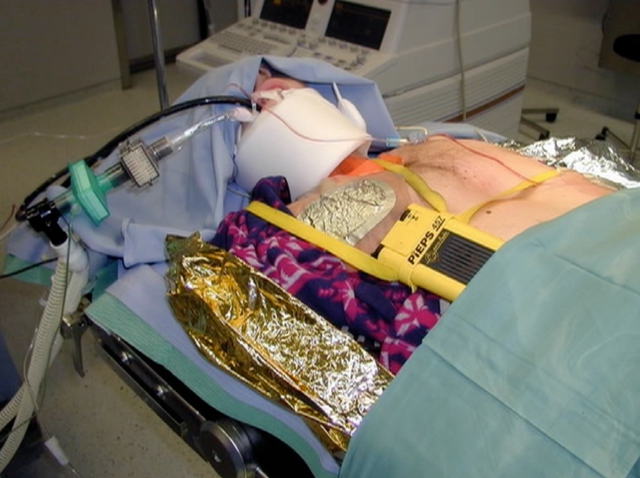
VICTIMS WITH NO VITAL SIGNS THAT ARE BURIED LONGER THAN 35 MINUTES BUT THAT HAVE A PATENT AIRWAY ARE LIKELY TO HAVE SUFFERED A CARDIAC ARREST FROM SEVERE HYPOTHERMIA AND ARE BEST TRANSPORTED TO EXTRACORPOREAL RE-WARMING WITH HEART-LUNG BYPASS. // INNSBRUCK MEDICAL UNIVERSITY ARCHIVES
TRIAGE
Where multiple victims exceed available resources then triaging becomes necessary, especially when other victims remain buried. Victims without vital signs, especially if in asystole, are far less likely to survive and place high demands on resources. Victims exhibiting major trauma that appears likely lethal are not likely to survive. Extremely hypothermic victims, especially if their core temperature is the same as ambient temperature and is less than 10°C, are unlikely to survive. A triage algorithm for avalanche incidents that incorporates avalanche and triage concepts has been published (Bogle et al., 2010).
CONCLUSION
Important field recommendations range from simple evidence-based victim-handling measures to integrating critical factors in crucial decisions that include prehospital termination of resuscitation. Advanced airway use as well as AED and core temperature monitoring are more relevant with improved training of avalanche professionals. Trauma management includes the use of tourniquets as well as decompression of pneumothorax. Triage of multiple victims on-site, and those severely hypothermic to appropriate centres, is enabled using the integrated avalanche resuscitation algorithm.
CONFLICT OF INTEREST
None of the authors have any financial conflict of interest. All authors have published on mountain medicine.
REFERENCES
Bogle, L.B., Boyd, J.J. and McLaughlin, K.A., 2010. Triaging multiple victims in an avalanche setting: the Avalanche Survival Optimizing Rescue Triage algorithmic approach. Wilderness Environ Med, 21(1): 28-34.
Boyd, J.J,, Brugger, H. and Shuster, M., 2010. Prognostic factors in avalanche resuscitation: a systematic review. Resuscitation, 81(6): 645-652.
Boyd, J.J., Haegeli, P., Abu-Laban, R.B., Shuster, M. and Butt, J.C., 2009. Patterns of death among avalanche fatalities: a 21-year review. CMAJ, 180(5): 507-512.
Brown, D.J., Brugger, H., Boyd, J.J and Paal, P., 2012. Accidental hypothermia. New England Journal of Medicine, 367(20): 1930- 1938.
Brugger, H., 2011. Avalanche accidents: ILCOR Guidelines 2010 & ICAR MEDCOM algorithm. Proceedings ICAR General Assembly, Are, Sweden.
Brugger, H., Durrer, B., Adler-Kastner, L., Falk,. M. and Tschirky F., 2001. Field management of avalanche victims. Resuscitation, 51(1): 7-15.
Brugger, H., Durrer, B. and Boyd, J.J., 2004. On Site Treatment of Avalanche Victims. Avalanche News, 71(Winter 2004-05): 30-33.
Brugger, H., Durrer, B., Elsensohn, F., Paal, P., Strapazzon, G., Winterberger, E., Zafren, K. and Boyd, J.J., 2012. Resuscitation of avalanche victims: Evidence-based guidelines of the international commission for mountain emergency medicine (ICAR MEDCOM): Intended for physicians and other advanced life support personnel. Resuscitation, 2012 Nov 2. pii: S0300- 9572(12)00876-3. doi: 10.1016/j.resuscitation.2012.10.020. [Epub ahead of print]
Brugger, H. and International Commission for Alpine Rescue, 2006. Time is Life - medical training in avalanche rescue. IKAR-CISA : Newport Music [distributor]
Danzl, D. F., 2012. Accidental Hypothermia. Wilderness medicine. Auerbach P. S.. Philadelphia, Mosby Elsevier: 116-142.
Falk, M., Brugger, H. and Adler-Kastner, L., 1994. Avalanche survival chances. Nature, 368(6466): 21.
Haegeli, P., Falk, M., Brugger, H., Etter HJ and Boyd J.J., 2011. Comparison of avalanche survival patterns in Canada and Switzerland. CMAJ, 183(7): 789-795.
Henriksson, O., Lundgren, P., Kuklane, K., Holmer, I., Naredi, P. and Bjornstig, U., 2012. Protection against Cold in Prehospital Care: Evaporative Heat Loss Reduction by Wet Clothing Removal or the Addition of a Vapor Barrier-A Thermal Manikin Study. Prehosp Disaster Med, 27(1): 53-58.
Hohlrieder, M., Brugger, H., Schubert, H.M., Pavlic, M., Ellerton, J. and Mair, P., 2007. Pattern and severity of injury in avalanche victims. High Alt Med Biol, 8(1): 56-61.
Luks, A. M. and Swenson, E.R., 2011. Pulse oximetry at high altitude. High Alt Med Biol, 12(2): 109-119.
Paal, P., Milani, M., Brown, D., Boyd, J.J. and Ellerton, J., 2012. Termination of Cardiopulmonary Resuscitation in Mountain Rescue. High Alt Med Biol, 13(3):200-8.
Pasquier, M., Rousson, V., Zen Ruffinen, G. and Hugli O., 2012. Homemade thermometry instruments in the field. Wilderness Environ Med, 23(1): 70-74.
Soar, J., Perkins, G. D., et al., 2010. European Resuscitation Council Guidelines for Resuscitation 2010 Section 8. Cardiac arrest in special circumstances: Electrolyte abnormalities, poisoning, drowning, accidental hypothermia, hyperthermia, asthma, anaphylaxis, cardiac surgery, trauma, pregnancy, electrocution. Resuscitation, 81(10): 1400-1433.
Vanden Hoek, T. L., Morrison, L. J., et al., 2010. Part 12: cardiac arrest in special situations: 2010 American Heart Association Guidelines for Cardiopulmonary Resuscitation and Emergency Cardiovascular Care. Circulation, 122(18 Suppl 3): S829-861.
Walpoth, B.H., Galdikas, J., Leupi, F., Muehlemann, W., Schlaepfer, P. and Althaus, U., 1994. Assessment of hypothermia with a new "tympanic" thermometer. J Clin Monit, 10(2): 91-96.
1) International Commission for Alpine Rescue
2) BLS = Basic Life Support; ALS = Advanced Life Support.
3) For example - Vancouver General Hospital, Royal Inland Hospital in Kamloops, Kelowna General Hospital or Foothills Medical Centre in Calgary.
4,5) For example - Vancouver General Hospital, Foothills Medical Centre in Calgary or University Hospital in Edmonton. Near future - Kelowna General Hospital
Tags:
avalanche victim
cpr
first aid
resuscitation
search and rescue
Permalink
| Comments (0)
|
|
|
Posted By Alex Cooper, Canadian Avalanche Association,
February 12, 2020
|
From volume 86, fall 2008
By James Floyer

INTRODUCTION
High resolution penetrometer technology has been around for a while now. The first analogue instrument was made in the 1970’s (Bradley’s resistograph) and a digital version was made a decade later (Dowd and Brown’s digital resistograph). Over the years a handful of instruments have appeared, hoping to lure practitioners into plunging probes into the snow and wean them off the laborious habit of digging pits. Although there still seems to be a lot of enthusiasm surrounding penetrometer technology, in practice the luring and the weaning just hasn’t happened yet.
While these fancy instruments have excited researchers with their ability to objectively and rapidly measure snowpack properties (most that have been produced measure hardness, some measure density), there are some good reasons why snowpack penetrometers have not found their way into everyday, mainstream snow assessment practices. One reason is cost. Personally, I don’t put too much store on this, as I firmly believe that people would be willing to pay quite a bit of money for an instrument if it made the task of assessing snowpack stability faster and/or more certain. Instead, I believe the more important reason is that we haven’t yet figured out how to reliably identify weak layers of interest (critical weak layers) from the penetrometer signals.
The study summarized here (see Floyer (2008, pp. 129-151) for a more detailed account) makes a step towards the goal of detecting critical weak layers by relating the shape of the penetrometer signal at a weak layer to the fracture character of that weak layer determined from a nearby compression test. Using the premise that weak layers that fall into the sudden fracture character category can be considered of critical interest, a scheme is presented that allows for this discrimination to be made. The scheme does require the weak layer to be pre-identified, so essentially this scheme is a method for determining the importance of a weak layer that has already been defined. At the University of Calgary, we have also been making progress towards weak layer detection, but for now, I’ll focus on the fracture character study.
METHOD
The penetrometer profiles for this study were collected using a modified SABRE penetrometer (Mackenzie and Payten, 2002) manufactured by Himachal Safety Systems. This manually driven instrument records force-resistance with depth at a frequency of 1000 Hz. The analytical techniques used here could readily be applied to data collected using other digital force-resistance penetrometers.
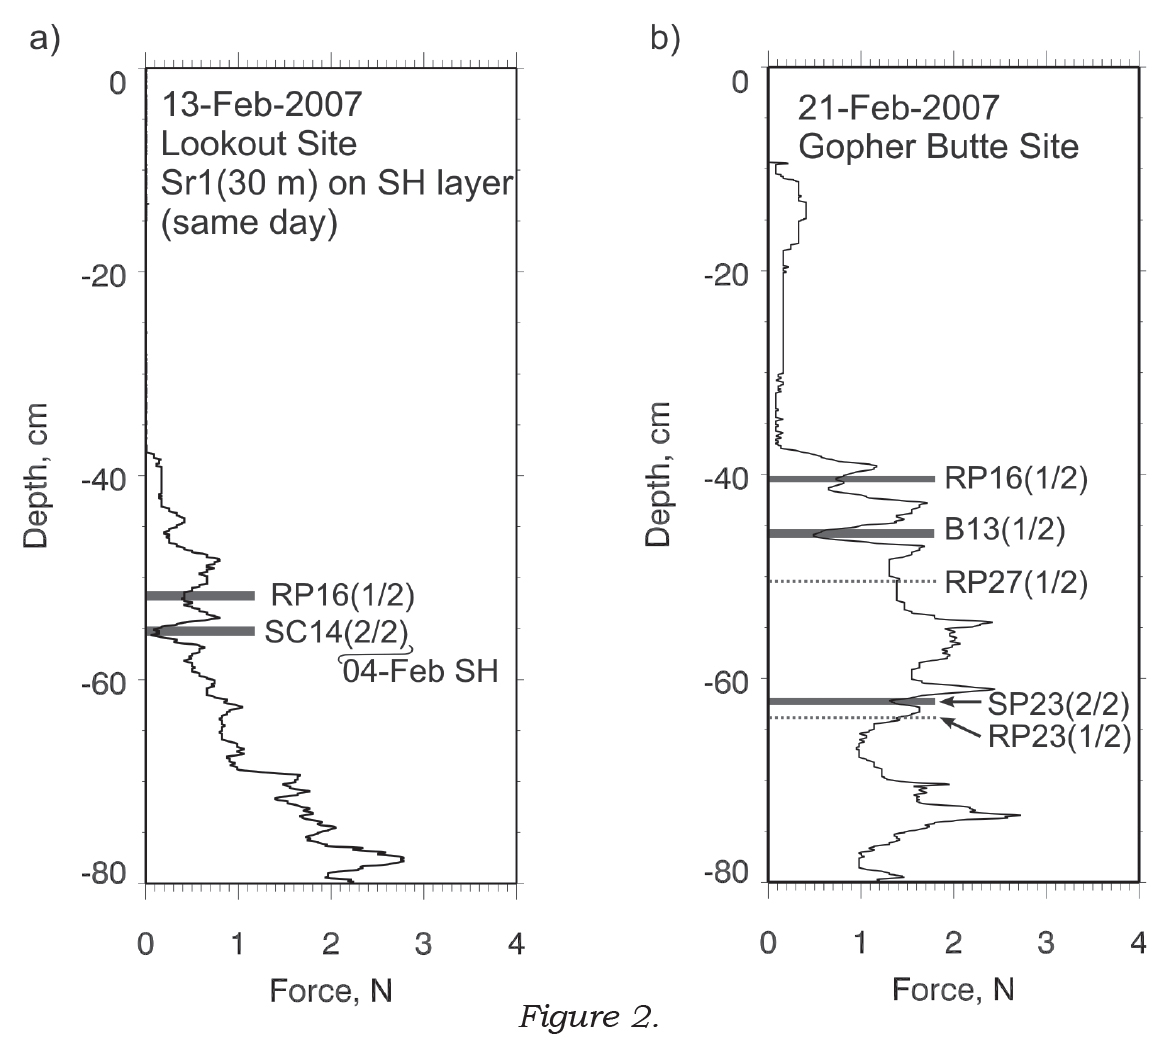
Compression tests were carried out in close proximity to the penetrometer profiles and the fracture character and depth of each fracture was recorded. In total, 78 penetrometer profiles and 56 compression test results were collected from 28 different site-days and 16 unique sites during the winter of 2007-2008. A typical test configuration is shown in Figure 1.
From the penetrometer profiles, weak layers (with thickness) or interfaces (with no thickness) were manually identified in the penetrometer signals using the depth information from the compression test results. Due to inaccuracies in the depth information associated with both penetrometer and compression test measurements, the weak layer/interface was interpreted in the penetrometer signal up to ±2 cm from the depth recorded in the compression test. Two examples of interpreted penetrometer pushes are shown in Figure 2. Fractures in very low resistance snow could not be identified, due to the SABRE penetrometer’s inability to measure fist resistance snow.
In total, 83 weak layers/interfaces (hereafter referred to as weak layers) were identified in the penetrometer signals. Of these, 41 were resistant planar fractures, 20 were sudden collapse, 14 were non-planar breaks, seven were sudden planar, and 1 was a progressive compression. Due to the low numbers of sudden planar and progressive compression fractures, it was decided to combine the classes into sudden fractures (sudden collapse and sudden planar) and others (resistant planar, non-planar breaks and progressive compression); this grouping reflects the higher incidence of skier-triggered avalanches associated with sudden fractures (van Herwijnen and Jamieson, 2007).
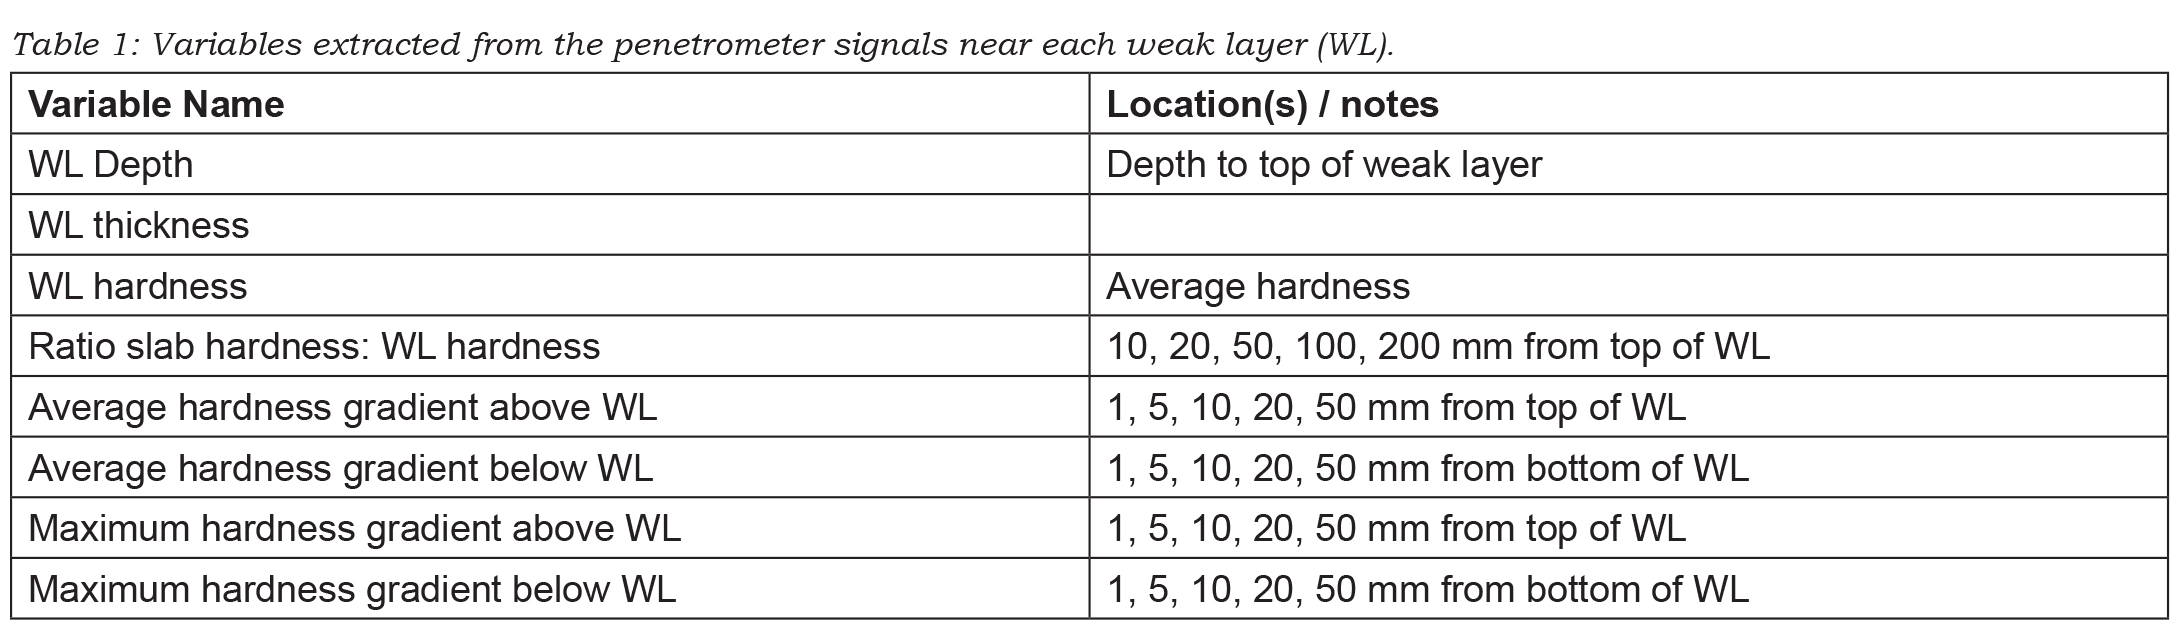
A number of variables were extracted from the penetrometer signals associated with and surrounding the interpreted weak layers. These variables are shown in Table 1. Some of the variables were tested at a number of different distances away from the top and bottom of the weak layer, since, for these variables, the optimum distance from the weak layer was unknown.
A univariate analysis was used to determine the variables that showed the greatest amount of difference in the signals associated with sudden and other groups of fractures. The best variables from the univariate analysis were selected for inclusion in a linear discriminant analysis. Discriminant analysis provides further information on the power of the variables to discriminate between the sudden and other groups, as well as giving a scheme for combining the variables and classifying the penetrometer signal into the sudden and other group.
RESULTS
The variables selected from the univariate analysis for inclusion in the discriminant analysis are shown in Table 2. The second column in this table shows the factor structure coefficients from the discriminant analysis, which gives a measure of the relative importance of each variable for discriminating between the sudden and other fracture character groups.
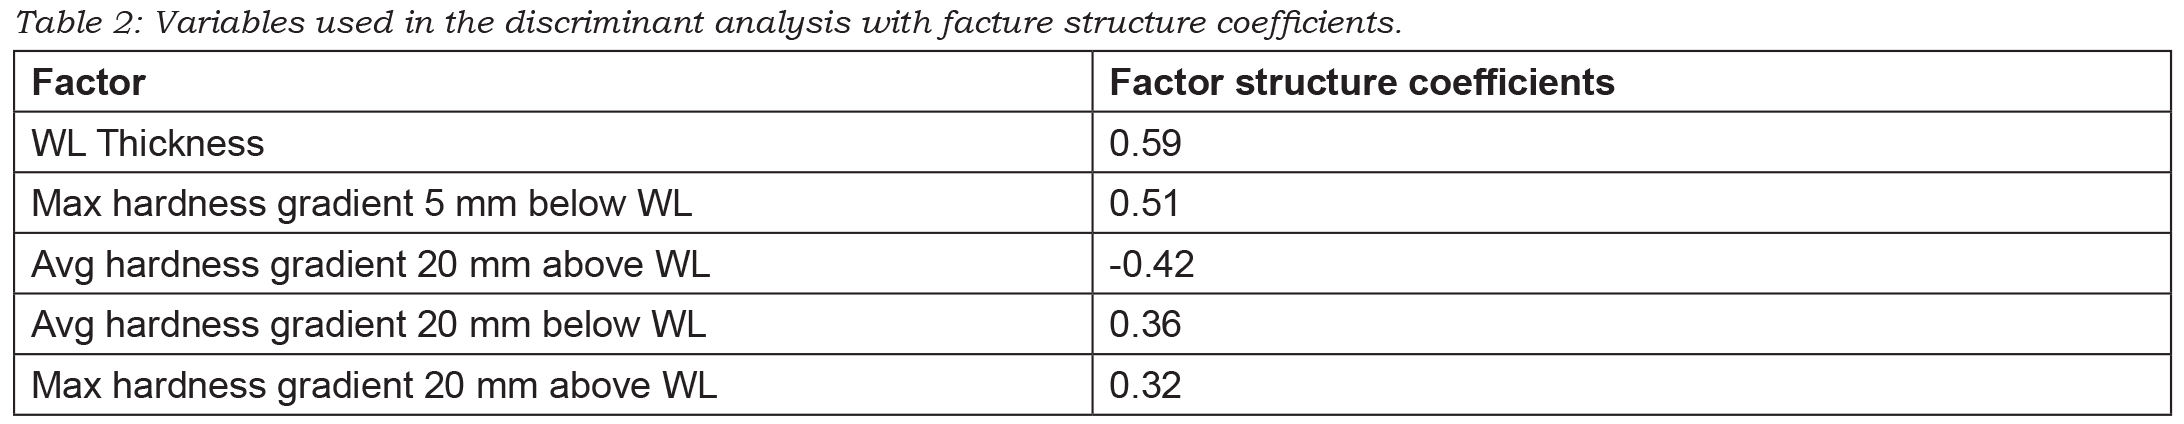
From the discriminant analysis results, weak layer thickness contributes the most to group separation, with thick layers selecting for sudden fractures. This has an intuitive explanation that thick weak layers are associated with sudden collapse fractures, which, in this analysis, account for the bulk of the sudden fractures. The variable with the second greatest contribution to group discrimination, maybe surprisingly, is the maximum hardness gradient up to 5 mm below the weak layer. For this variable, the absolute value for the maximum was used, so the positive value means that a greater maximum hardness gradient selects for sudden fractures. The average hardness gradient 20 mm below the weak layer also contributes to discrimination, although to a lesser extent. These two variables combined indicate that a stiffer substratum may favour sudden fractures.
Both the average gradient and the maximum gradient 20 mm above the weak layer also contribute to group separation, with factor loadings of -0.42 and 0.32 respectively. The negative value for the average gradient is associated with the negative average gradient values above the weak layer (generally a decrease in hardness with an increase in depth); so a higher negative value still indicates that higher values are associated with sudden fractures. These variables relate to the generally accepted view that a stiffer layer of snow above the weak layer is important for fracture propagation (van Herwijnen and Jamieson, 2007).
The discriminant function built using standardised function weights (not shown, see Floyer (2008, p. 164)) was used to classify the weak layer/interfaces identified in the penetrometer signals into sudden or other fracture character groups. Using a leave-one-out cross-validation method, 77.8% of sudden fractures were correctly classified and 81.5% of other fractures were correctly classified. The overall prediction rate was 79.6%. Classification parity was good between the two groups.
SUMMARY
A method for predicting the broad fracture character group (sudden or other) from penetrometer signals has been developed, based on a multivariate statistical analysis of penetrometer signals interpreted against fracture character results from nearby compression tests. Using a leave-one-out cross-validation method, overall classification rates of approximately 80% were achieved. Weak layer thickness, maximum hardness gradient 5 mm below the weak layer and the average hardness gradient 20 mm above the weak layer contributed the most to discriminating between the two groups.
Results for the sudden category were likely biased towards sudden collapse fractures, which dominated the data set used in this study. More observations are necessary to be able to distinguish between sudden collapse and sudden planar fractures in the sudden category, as well as between the resistant planar, progressive compression and non planar break fractures within the other category. There are also concerns over the subjective nature of the penetrometer signal interpretation, although this was mitigated by setting limits on the window in which the weak layer could be identified.
These results are promising, since they indicate that weak layers may be classified on the basis of fairly simple parameters extracted from the penetrometer signal. If combined with layer detection methods and possibly micro-structural information from higher resolution penetrometers (such as the SnowMicroPen), we move closer to the possibility of automated critical weak layer detection from penetrometer signals.
ACKNOWLEDGMENTS
I would like to thank Bruce Jamieson, who supervised my degree at the University of Calgary. I would also like to thank the entire ASARC crew, the staff at a great number of operations in BC and AB, and the various financial supporters of the ASARC program.
REFERENCES
Floyer, J. A., 2008. Layer detection and snowpack stratigraphy characterisation from digital penetrometer signals, (Ph.D. thesis), Dept. of Geoscience, University of Calgary, Calgary, Canada.
van Herwijnen, A. and B. Jamieson, 2007. Fracture character in compression tests, Cold Regions Science and Technology, 47(1-2), 60–68.
Mackenzie, R. and W. Payten, 2002. A portable, variable-speed, penetrometer for snow pit evaluation, Proceedings of the International Snow Science Workshop (2002: Penticton, BC), 294–300.
Tags:
james floyer
penetrometer
snow profile
snow science
snowpack tests
Permalink
| Comments (0)
|
|
|
Posted By Alex Cooper, Canadian Avalanche Association,
February 5, 2020
|
From volume 115, summer 2017
By Lisa Larson

FIG. 1: ICAM RISK MANAGEMENT CHART
IN 2008, WE BEGAN TRACKING HIGH-POTENTIAL INCIDENTS, which are defined as incidents that have a reasonable likelihood to cause or have caused a significant but not life-altering injury to a worker. In 2013, we standardized our approach for identifying the root causes and contributing factors for such incidents through a technique called the Incident Cause Analysis Method (ICAM).
ICAM involves the identification of systemic health, safety or environmental deficiencies. It outlines an investigative process and a set of tools that consider, but also look beyond, human error and examines all of the contributing factors leading to incidents. It also enables the development of recommendations aimed at preventing incidents from re-occurring. (www.teck.com, 2014)
Incident investigation starts with good data collection. Putting a team together that includes members with technical or operational experience relevant to the nature of the event, with no potential conflict of interests with the investigation. Once assembled, the group determines which data needs to be collected. The collection of data covers five categories: People; Environment; Equipment; Procedures/ Documents; and Organization (PEEPO). This first round of data collection can result in a mountain of information; each piece needs to be analyzed to determine if it is verified as fact and it contributed to the event, for example, the incident occurred at 18:30 hours (fact); the sun was low in the sky making the track difficult to see (contributing factor).
The next step is to organize the data by creating a timeline using the relevant information from the initial evidence gathering. Descriptions are recorded with a timestamp, where available, for any observed action or inaction that may contribute to the timeline. Constructing a detailed chronology provides a clear picture for the investigation team of events leading up to, before and after the incident.
Once the timeline is in order, the team works through each event and determines if it did indeed contribute to the incident. Where events have contributed to the incident, the team performs a process called 5 Whys. Beginning with why did it contribute, the process then continues to ask why, until it arrives at one of three possibilities:
- A point of control
- A point beyond control
- A point that requires further information to answer “why?”
The 5 Why process will help identify organizational factors/root causes of an incident by encouraging the team to avoid assumptions/biases and dig deeper into the conditions that led to each contributing factor.
The ICAM process is then used to pinpoint underlying causes of the incident, rather than focus on potential errors of the people involved. ICAM is based on principles developed by James Reason, an expert in human factors and author of many books on the subject. James Reason also developed the Swiss cheese model as a metaphor for how incidents occur.
Each layer of cheese represents defenses in our safety systems. Ideally each layer would have no holes, but defenses are like Swiss cheese. A hole in one layer may not cause an incident, however, when holes in the defenses align briefly, it provides opportunity for an incident to occur.
Holes occur for two reasons:
- Active Failures: Errors and violations having immediate negative results, usually caused by an individual
- Latent Failures: Caused by circumstances such as scheduling problems, inadequate training, or lack of resources. Latent failures can lay dormant in the system for many years before combining with active failures to provide opportunity for an incident to occur (AviationPros, 2006)
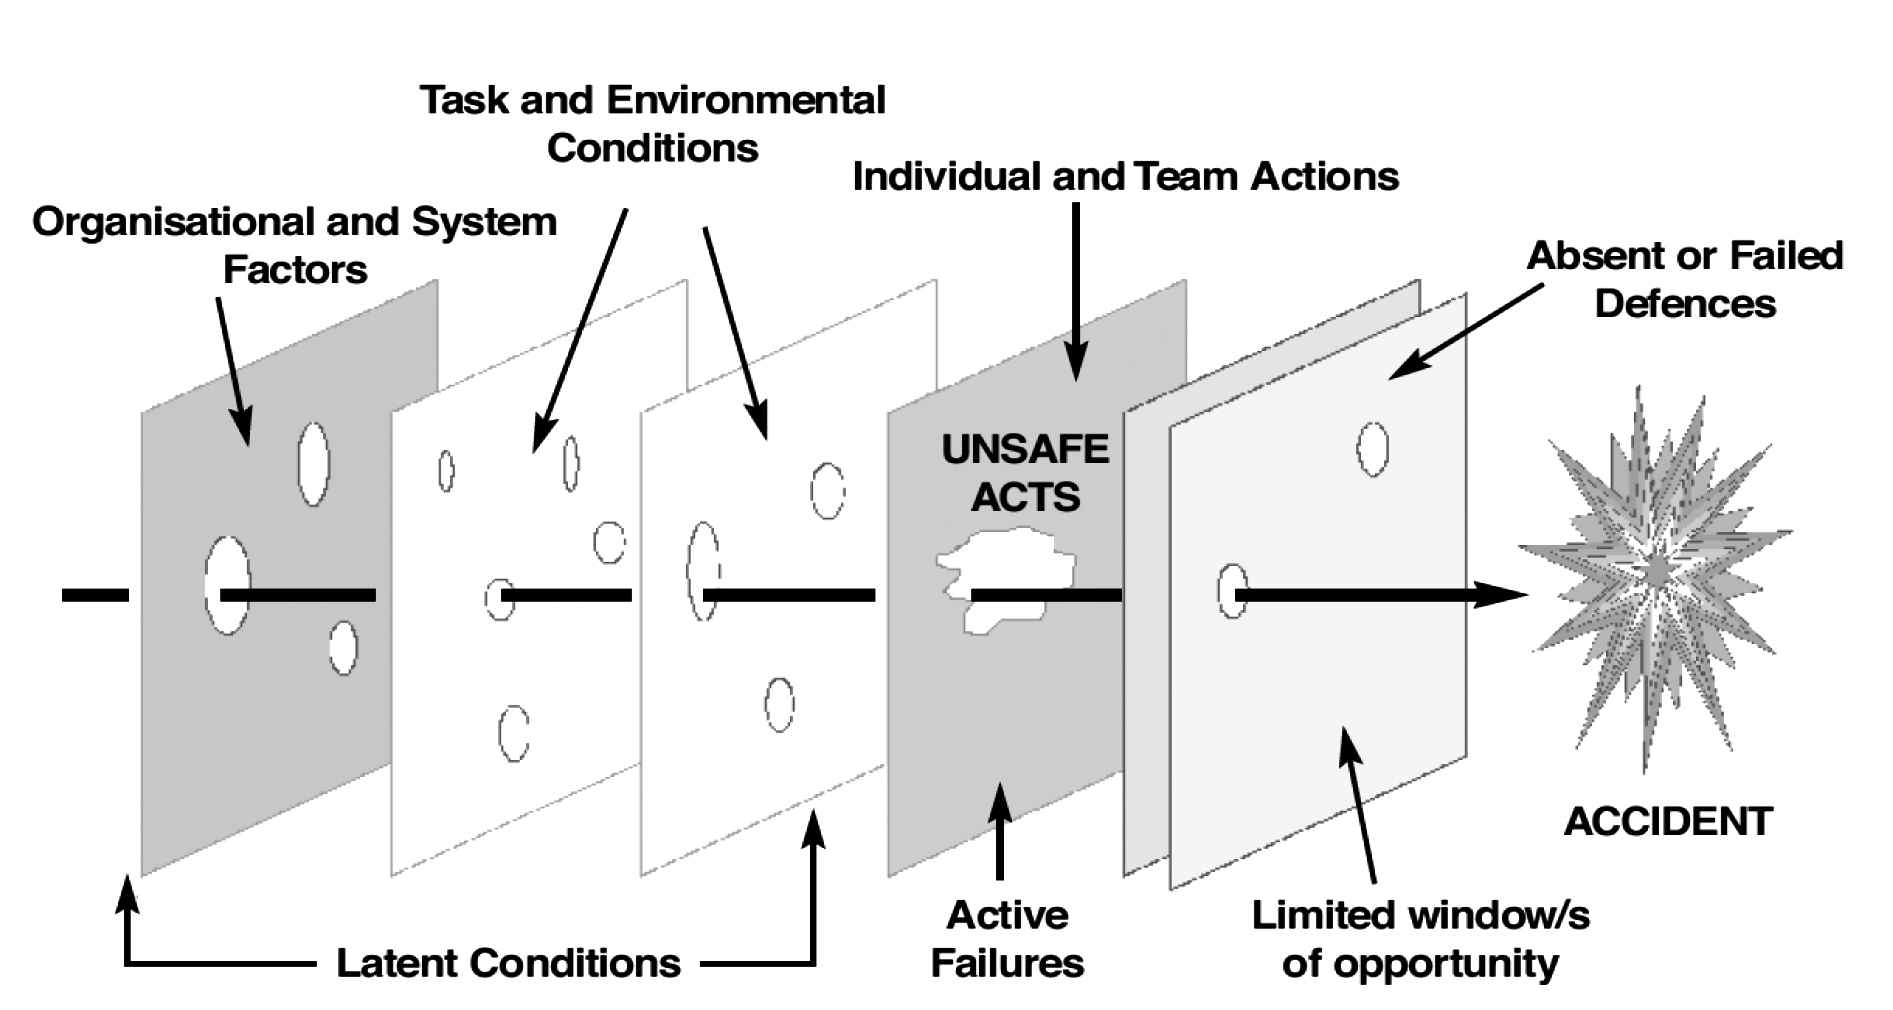
FIG. 2: SAFETY WISE SOLUTIONS INCIDENT INVESTIGATION REFERENCE GUIDE, NOVEMBER 2006
Having organized the data to create a timeline, probed contributing events using the 5 Why process to pinpoint underlying causes, the next steps in the ICAM process are to classify factual information in order to identify:
- Absent and Failed Defenses
- Individual/Team Actions
- Task/Environmental Conditions
- Organizational Factors
Once the information is classified, the team must develop clear recommendations to address deficiencies. Recommendations will be developed for all absent or failed defenses and organizational factors identified.
By using ICAM framework to identify root causes and key contributing factors, the investigation team, employees and organization can feel confident that the recommendations are based on fact, not bias, and when acted upon will lead to continual improvement of safety systems to prevent the reoccurrence of a similar incident.
This post has not been tagged.
Permalink
| Comments (0)
|
|
|
Posted By Alex Cooper, Canadian Avalanche Association,
January 29, 2020
|
From volume 96, spring 2011
By Bruce Jamieson, Dept. of Civil Engineering, Dept. of Geoscience, University of Calgary, Calgary AB, Canada
Jürg Schweizer, WSL Institute for Snow and Avalanche Research SLF, Davos, Switzerland
Grant Statham, Parks Canada Agency, Banff AB, Canada
Pascal Haegeli, Avisualanche Consulting and Simon Fraser University, Vancouver BC, Canada
ABSTRACT
At the 2004 ISSW, Roger Atkins proposed that—early in the terrain selection process—backcountry travellers could identify which types of avalanches were likely, e.g. wind slab, persistent slab, wet avalanche. These avalanche types are analogous to a set of scenarios in traditional risk analysis. Variations on Atkins’ approach have been incorporated into some public bulletins. The types of avalanches that dominate the danger ratings are called Avalanche Types/Characters/Threats/Concerns/Situations/Problems by different groups. The latest Swiss brochure for recreation in avalanche terrain suggests different observations for the four different types of avalanche situations. To help determine which observations are best for which types of avalanches, a field study was conducted in the winters of 2008-09 and 2009-10 in the Coast Mountains, Columbia Mountains, and Rocky Mountains of western Canada. On each field day, an experienced field team rated the local avalanche danger, identified two dominant avalanche types and observed a standard set of over 20 quick field observations. The quick observations included avalanches, wind transported snow, snowfall, etc. For correlation analysis, we focussed on two distinct classes of avalanche types: 1) persistent slabs, and 2) wind slabs combined with storm slabs. While some observations correlated with the local danger when either class of avalanches dominated the danger rating, other observations correlated best when only one of these two classes dominated the local danger rating. These results may help bulletin writers recommend that recreationists focus on certain local observations for better informed decisions.
INTRODUCTION
For decades, risk analysts for natural hazards have identified distinct scenarios (or potential events) which threaten something of value e.g. property or infrastructure. For each scenario, the probability of the natural event affecting the thing of value and the expected consequences are estimated (Kaplan and Garrick, 1981). Mitigation, if required, typically focuses on the scenarios with the highest risk (combination of probability and consequences). If the probability and consequences for each scenario can be quantified, the risk for the can be graphed as in Figure 1. If either the probability or consequence can only be ranked (not quantified), the scenarios are usually presented in a risk matrix (e.g. Ahrens, 2008, p. 22-24). The scenarios with the highest risk (or unacceptable risk) can be targeted for mitigation. This established approach to risk analysis has been used for long-return period avalanches that can affect property (e.g. Wilhelm, 1998). The same concept is also used informally by guides, forecasters and experienced recreationists, who often focus on one or two types of avalanches (scenarios) when assessing the risk on the terrain being considered for the current day.
For many years some Swiss guides and avalanche educators have proposed asking: “What is the main danger today?” On most days, it can be decided whether it is either a New Snow, and Old Snow, or a Wet Snow situation.
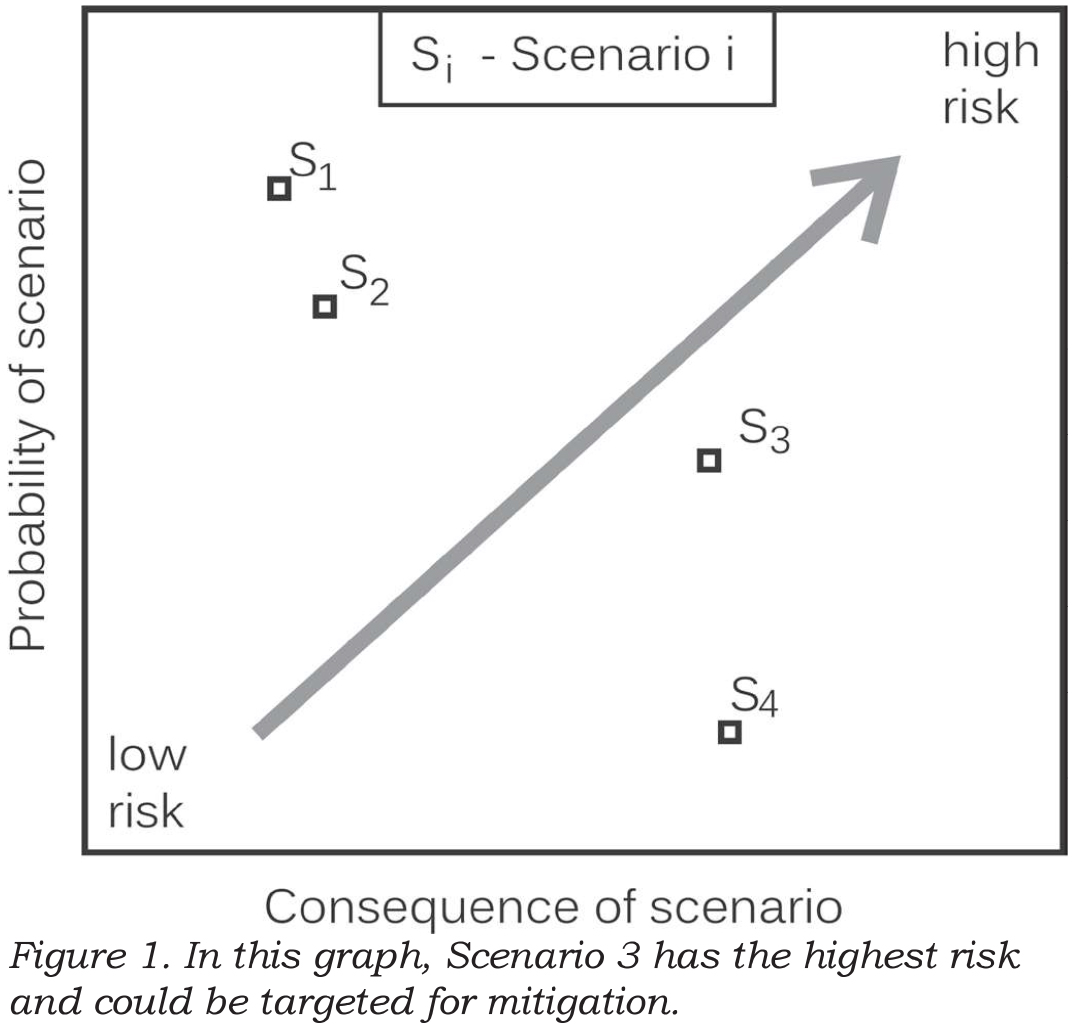
Once the situation is recognized, the mitigation strategy can be adapted (Wassermann and Wicky, 2003). Stephan Harvey has further formalized this approach, called it pattern recognition and added one more situation: Wind Driven Snow, when an increased avalanche danger often prevails (Harvey, 2008).
In parallel with the Swiss development of Avalanche Situations, at the 2004 ISSW in Jackson Hole, Roger Atkins proposed that the probability and consequences be assessed separately for different types of avalanches, e.g. wind slab, persistent slab, wet avalanche, so the decision makers could focus on the one or two scenarios (Avalanche Types) that posed the greatest risk. Some of his avalanche characteristics incorporated terrain, e.g. wind slabs near ridge tops.
Atkins’ concept was used by the Avalanche Danger Scale Project, which was a Canada-US part of the multi-agency project called Avalanche Decision Framework for Amateur Recreationists 2 (ADFAR2). Starting in 2005, the committee of mostly forecasters took a fresh look—actually fresh look after fresh look—at the forecasting process. When they finally had a consensus, the Avalanche Type was a key component of their conceptual forecasting model (Statham et al., 2010). Definitions for the different types of avalanches have been developed. These definitions were the basis for incorporating Avalanche Problems into Canadian avalanche bulletins (Klassen, 2010).
Most recently, Avalanche Type been used as the central theme in a field book for decision-making in avalanche terrain published by the Canadian Avalanche Centre (Klassen et al., 2010). The field book contains templates for recording the relevant observations and facilitates decisions when preparing for and travelling in avalanche terrain.
The concept of Avalanche Type has been and will continue to be applied at various scales. At the slope scale, experienced forecasters and guides can visualize certain types of potential avalanches on the terrain. At the regional scale, some avalanche forecast centres have started to use one, two, or occasionally three Avalanche Types in their public bulletins. Although there is as yet no consistent terminology (Table 1), the concept has caught on and is now used in various applications.
When updating the popular Swiss avalanche awareness brochure “Caution – Avalanches!” the idea of Avalanche Situations was merged with the reduction method with the classical 3x3 framework (Harvey et al., 2009). For each of the four Avalanche Situations, a number of key observations are proposed to help recreationists focus on the most important observations for the day (Table 2).
Early experience with this scheme suggests that on some days it is difficult to distinguish between new snow and wind driven snow. Also, the debate continues about whether to explicitly recommend digging when old snow is the dominant avalanche situation. On the other hand, the emphasis is not on digging when either new snow, wind driven snow or wet snow is the primary avalanche situation.
The relevant observations for each Avalanche Type in Table 2 are based on experience and an understanding of the processes that form the different types of potential avalanches. Haegeli and Atkins (2010) also present key observations from a survey of experienced avalanche professionals. For this study, we set out to use field data (independent of theory or experience) to identify some key observations when different types of avalanches were dominating the danger rating.

METHODS AND DATA
Since the winter of 2007, the Applied Snow and Avalanche Research group at the University of Calgary (ASARC) has been rating the local avalanche danger and making a standard set of over 20 observations (e.g. Jamieson and Haegeli, 2008; Appendix A). Starting in the winter of 2009, we began daily rating the top two Avalanche Types so we could assess which observations were “best” for the various types of expected avalanches. This paper summarizes the results from the winters of 2008-09 and 2009-10.
On most field days in the winters of 2008-09 and 2009-10, ASARC’s field teams in the Coast Range, Columbia Mountains and Rocky Mountains rated the local avalanche danger, made over 20 standard observations (Appendix A), and identified the two most important Avalanche Types (Table 1). For this study we used only the Avalanche Type with the greatest importance—based on its contribution to the danger rating. If the two avalanche types had equal importance (50:50), we used the one recorded as Avalanche Type 1.
Many of the observations were made before and after the decision point, i.e. when the team reached treeline. For each observation, e.g. blowing snow, we used the before or after observation that was more conducive to higher avalanche danger. So, if we observed blowing snow in the morning but not in the afternoon, we used the morning observation.
For most of the observation variables, the specific observation values could be ordered from the least associated with avalanching to the most. For example, the observations for blowing snow were ordered: none, at ridge, below ridge.
Appendix A shows that we rated the local danger for one, two or three elevation zones: below treeline, treeline and alpine. We used the treeline rating, except in four cases in which we did not rate the local avalanche danger at treeline, in which case we used the below treeline rating.
In a few cases in which the precipitation was rain, we treated the precipitation rate as missing. This resulted in the dataset shown in Table 3. Each case is a record of one field team travelling on touring skis in a specific area on a given day.
We excluded Loose Avalanche and Wet Avalanche types from the analysis since there were too few cases. Also because of limited cases, we combined Storm Slab with Wind Slab, and combined Deep Persistent Slab with Persistent Slab.
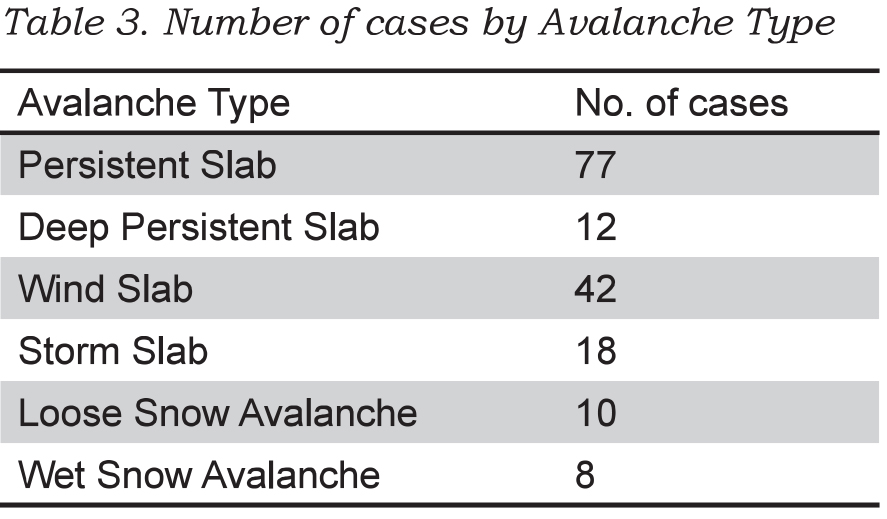
PRELIMINARY RESULTS
Spearman rank correlations between the local danger rating and the ordered observations are shown in Table 4. Correlations for which p < 0.05 are marked in bold. Correlations for which p < 0.01 are marked in bold italic.
Observations that correlated when either class of Avalanche Type was important?
When either Wind Slab/Storm Slab Avalanches or Deep/Persistent slab avalanches dominated the danger rating, the observations that correlated with the local avalanche danger were: slab avalanches, whumpfs/shooting cracks, clumps of snow falling off trees (tree bombs), deep ski penetration, snow height (snowfall) from in last 24/48 h, and air warming to 0°C (negative) (Table 4). The negative correlation prompted a second look at the data: when the air temperature reached 0°C (usually spring time), the avalanche danger was mostly Low or Moderate.
Observations that correlated when storm snow or wind slabs were important?
In addition to the observations mentioned in the previous paragraph, the snowfall rate, increased hand shear depth and absence of a surface melt-freeze crust correlated with the local avalanche danger when storm snow or wind slabs dominated the danger rating (Table 4). The key variables include the following observations of current or recent snowfall: snowfall rate, accumulated snowfall in the last 24/48 hours, as well as deep ski penetration.
Observations that correlated when deep/persistent slab avalanches were important?
In addition to the observations mentioned for both classes of Avalanche Types, low hand shear resistance, pinwheeling, and snow surface cracking at skis correlated with the local avalanche danger when Deep/Persistent Slab Avalanches dominated the local danger rating.
DISCUSSION
The observations proposed by the Swiss avalanche awareness brochure Caution – Avalanches! (Harvey et al., 2009) and the Canadian Avalanche Centre field book (Klassen et al., 2010) are supported by the correlations in Table 4. For a New Snow Avalanche Situation, recent slab avalanches and new snow amount correlated with the local avalanche danger. For an Old Snow Avalanche Situation, whumpfs correlated with the local avalanche danger. Some correlations, such as the one between pinwheeling and the local danger when Deep/Persistent Slabs are important, are difficult to explain and may not be significant in a larger, more balanced dataset.
For Deep/Persistent Slabs, fewer observations correlated with local danger than for Storm Snow and Wind Slab Avalanches, which is consistent with the greater forecasting challenge for persistent slabs. See also the limited relevant observations in Table 2 for the Old Snow Avalanche Situation.
Research often yields unexpected results. When ASARC’s morning stability evaluation was expanded to include identification of the one or two most important Avalanche Types, one of us (Jamieson) expected the usual response to increased paperwork. Instead, the field staff liked the focus that Avalanche Type provided to the morning safety meeting and has retained it. The Avalanche Type is just one part of the rethinking of the forecasting (Statham et al., 2010) that has become popular with ASARC’s field staff.
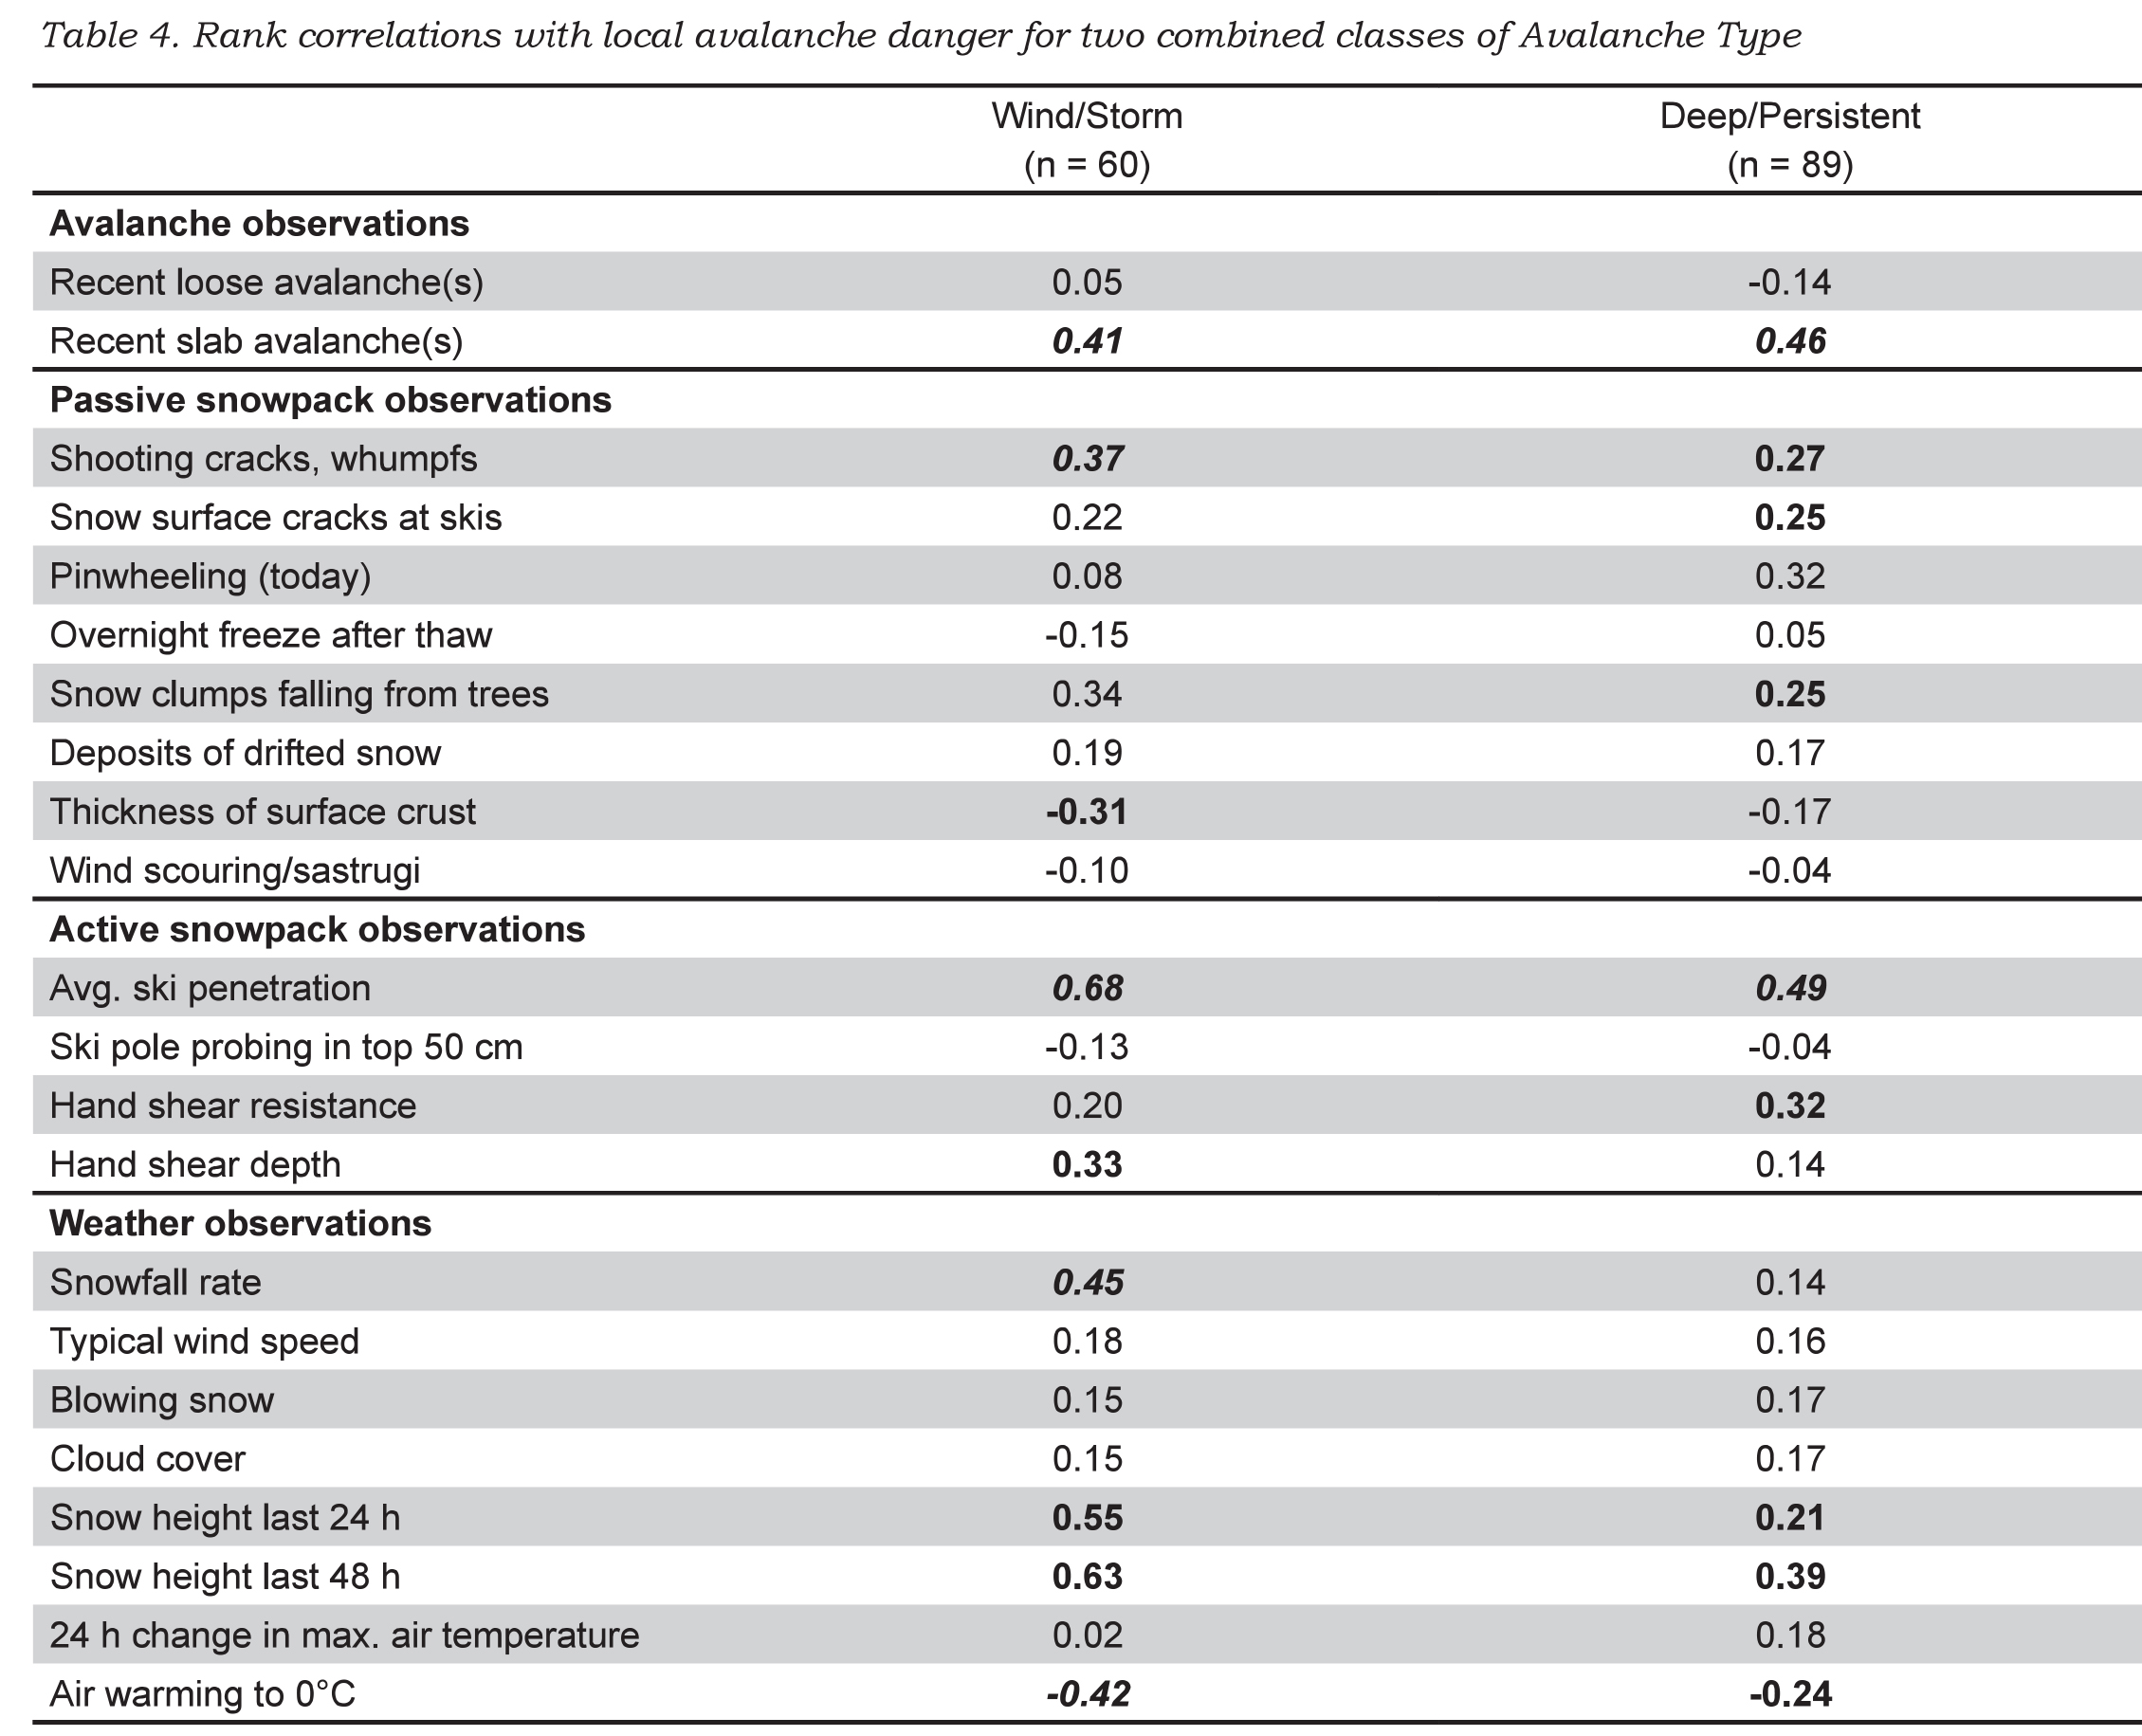
SUMMARY
Several regional forecast centres have adopted the concept of Avalanche Character/Type/Threat/Concern/Situation/Problem for use in their public bulletins. This concept is consistent with the scenarios in traditional risk analysis. Harvey (2008) has proposed specific observations for certain classes of Avalanche Situations. For this study, we analysed a dataset of 159 cases (locationdays) in which over 20 observations were made and the local avalanche danger was rated. When the dominant Avalanche Type was either Storm Avalanches or Wind Slabs, the observations that correlated (and were consistent with knowledge of avalanche formation) included recent slab avalanches, snowfall rate, snow clumps falling from trees (usually indicative of wind or warming), deep ski penetration and snow height from the last 24/48 hours. When the dominant Avalanche Type was either Deep Persistent or Persistent Slab, the observations that correlated (and made sense) included recent slab avalanches, whumpfs/shooting cracks, deep ski penetration and increased snow height from the last 24/48 hours.
Further field studies are planned. There are other observations that correlated in this study and may benefit from analysis of a larger dataset. However, any recommended observations should be consistent with the current understanding of the processes that form the different types of avalanches.
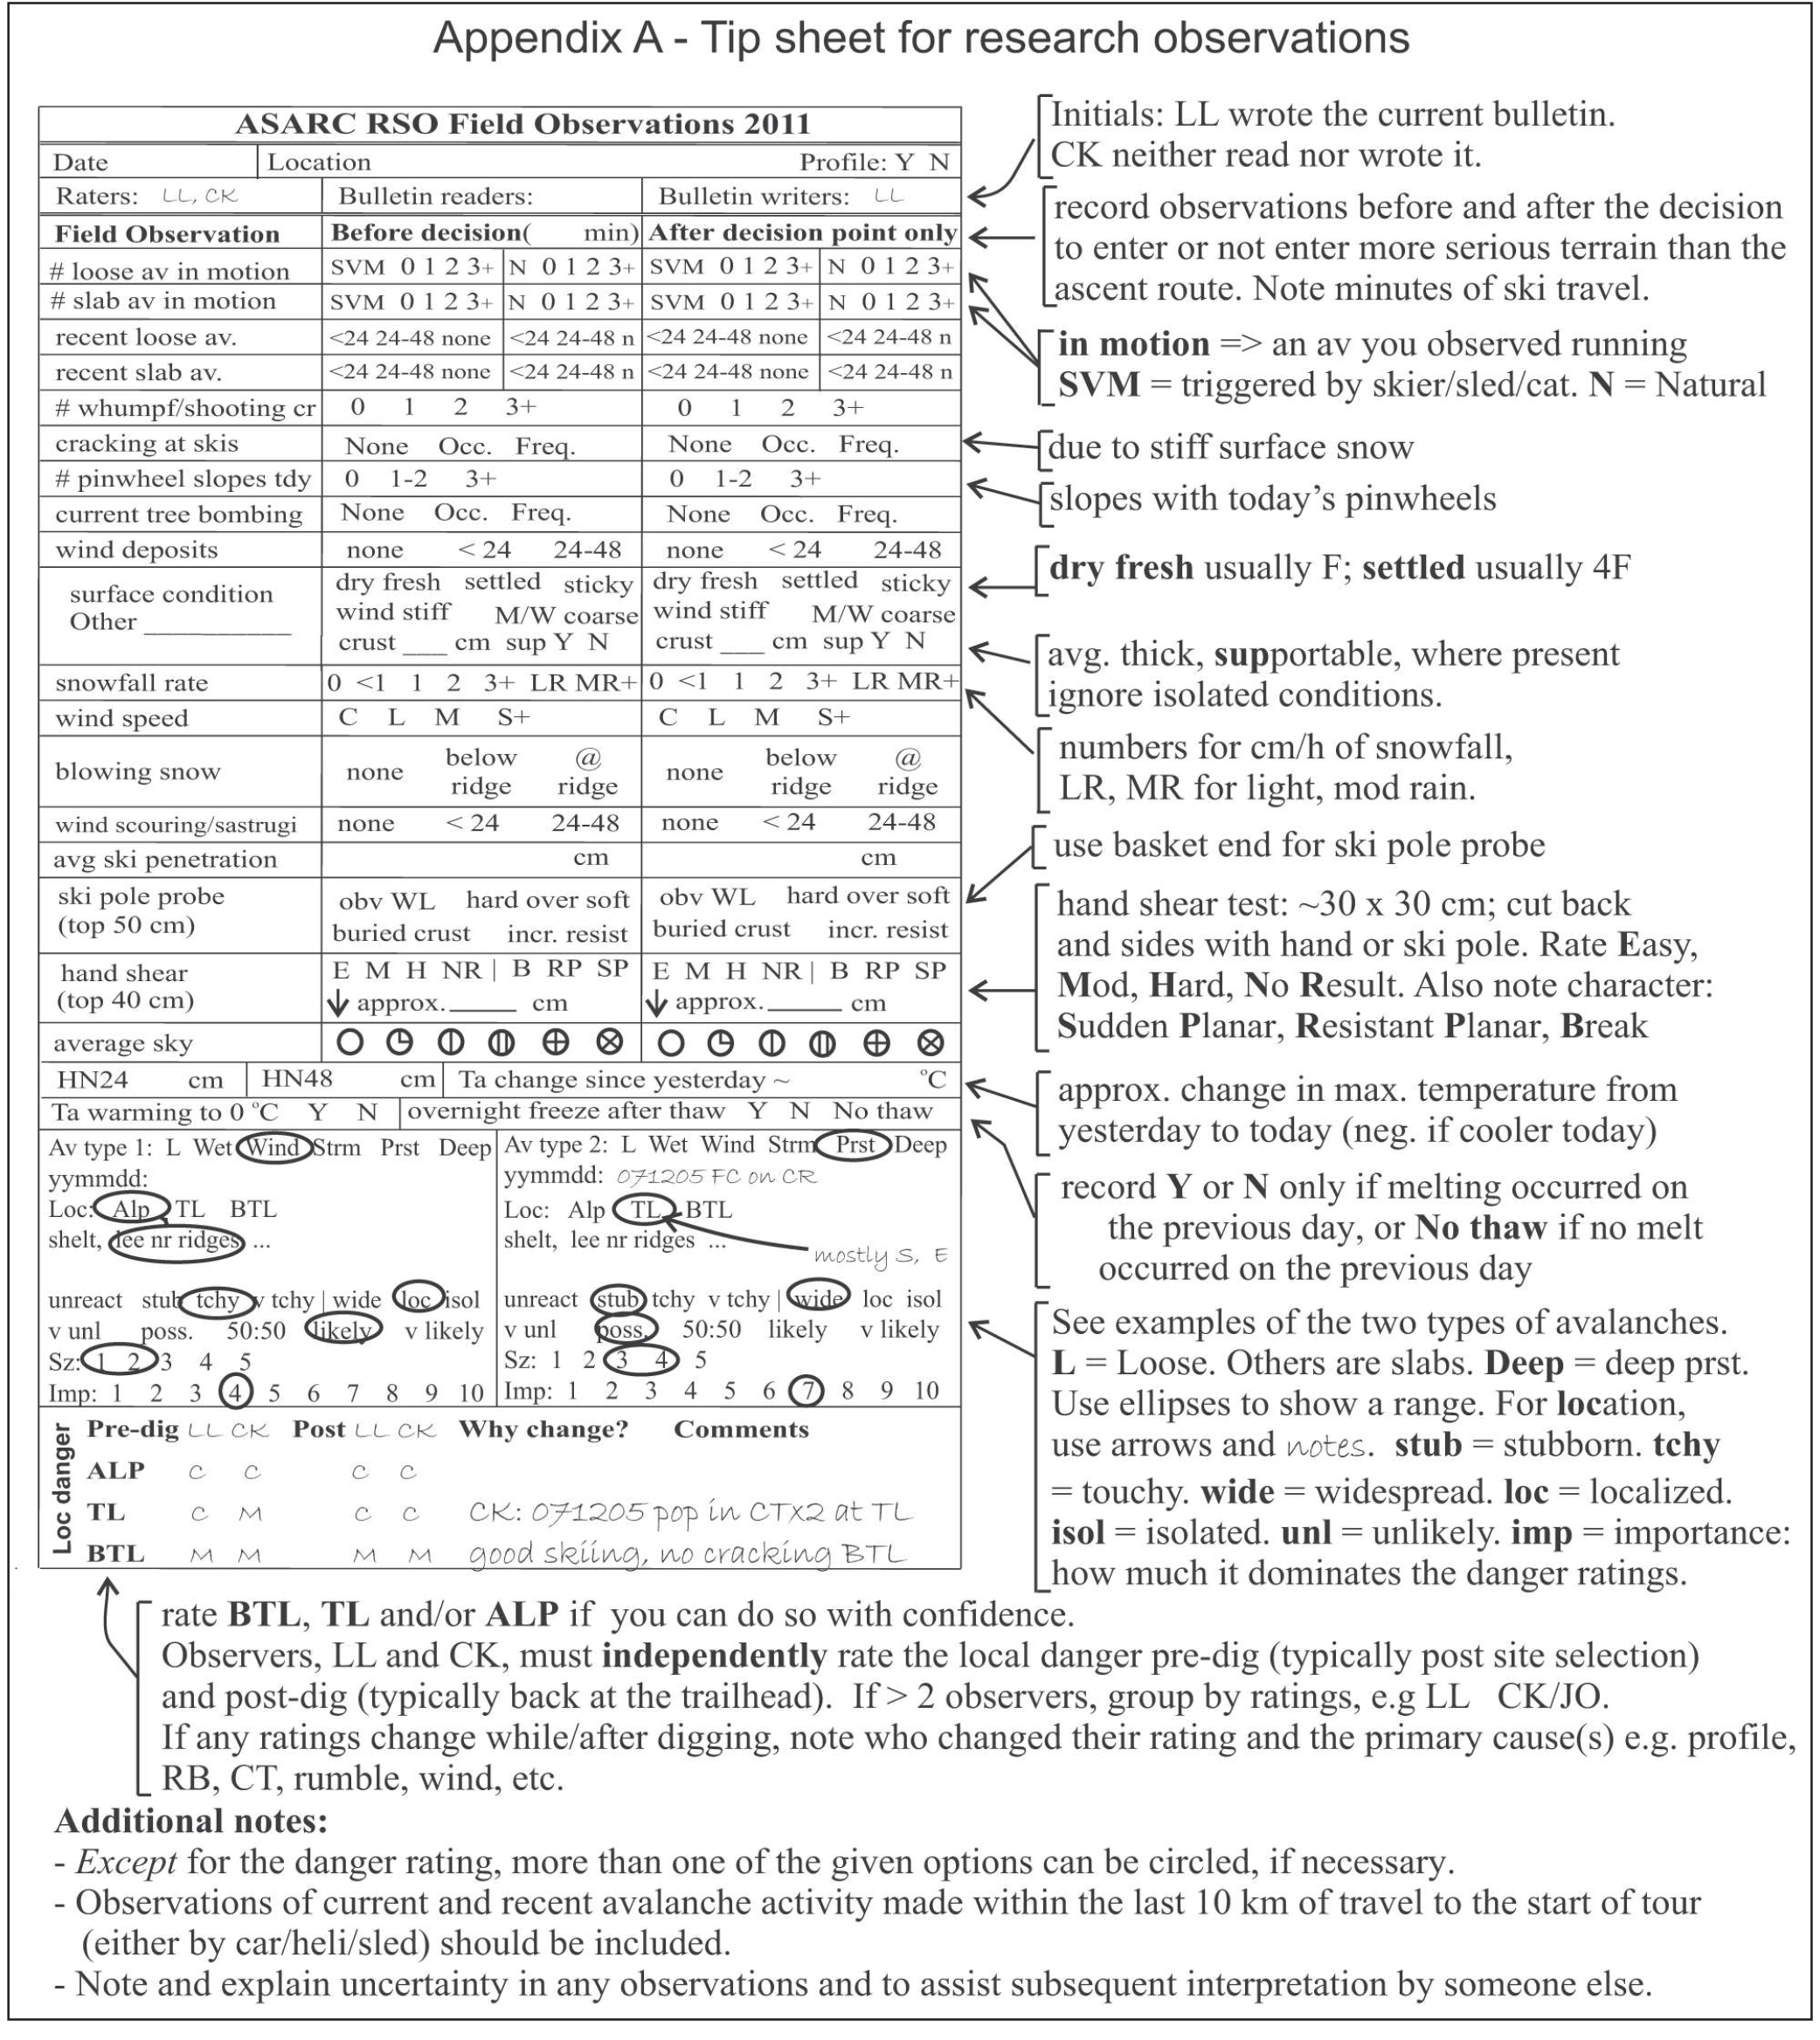
ACKNOWLEDGEMENTS
For the careful field work we are grateful to Cam Campbell, Spencer Krkosky, Deanna Andersen, Lydia Marmont, Peter Marshall, Chris Geisler, Ali Haeri, Cameron Ross, Thomas Exner, Mark Kolasinski, Katherine Johnston, Cora Shea, Mike Smith, Dave Tracz and Jordan Stiefvater. Thanks also to Mike Smith for proofreading, to Cameron Ross for checking the data and Dave Gauthier for checking the analysis.
For logistical support for the field studies we thank Mike Wiegele Helicopter Skiing, BC Ministry of Transportation and Infrastructure, BC Ministry of Parks, Parks Canada, the Canadian Avalanche Centre, as well as the Avalanche Control Section of Glacier National Park.
For financial support for the field studies and the first author’s time, we thank the Natural Sciences and Engineering Research Council of Canada, HeliCat Canada, the Canadian Avalanche Association, Mike Wiegele Helicopter Skiing, Teck Mining Company, Canada West Ski Areas Association, the Association of Canadian Mountain Guides, Backcountry Lodges of British Columbia, and the Canadian Ski Guides Association.
REFERENCES
Ahrens, T. 2008. Risk Analysis. John Wiley & Sons, Chichester, England.
Atkins, R. 2004. An avalanche characterization checklist for backcountry travel decisions. Proceedings of the 2004 International Snow Science Workshop in Jackson Hole, Wyoming, USA, 462-468.
Haegeli, P., Atkins, R. 2010. Exploring the ‘It depends’ – How do mountain guides assess avalanche situations? In Osterhuber,
R. and Ferrari, M. (eds.), Proceedings of the 2010 International Snow Science Workshop in Squaw Valley, California, USA, 130-132.
Harvey, S. 2008. Mustererkennung in der Lawinenkunde. In: I. Kroath (Editor), Sicherheit im Bergland. Oesterreichisches Kuratorium für Alpine Sicherheit, Innsbruck, Austria, pp. 88-94.
Harvey, S., Schweizer, J., Rhyner, H., Nigg, P., Hasler, B. 2009. Caution - Avalanches! 6th edition. Avalanche Prevention in Snow Sports, Core team of instructors, Davos, Switzerland.
Jamieson, B., Haegeli, P. 2008. Can field observations be combined systematically with the regional danger rating to estimate the local avalanche danger? Proceedings of the 2008 International Snow Science Workshop in Whistler, BC, 228-237.
Kaplan, S., Garrick, B.J. 1981. On the quantitative definition of risk. Risk Analysis 1(1), 11-21.
Klassen. K. 2010. The Avalanche Hazard Assessment Web-tool – A structured approach to public avalanche forecasting. Presentation at the Spring Conference of the Canadian Avalanche Association, 6-7 May 2010.
Haegeli, P., Atkins, R., Klassen, K. 2010. Decision Making in Avalanche Terrain. Canadian Avalanche Centre, Revelstoke, BC, 62 pp.
Statham, G., Haegeli, P., Birkeland, K., Greene, E., Israelson, C., Tremper, B., Stethem, C., McMahon, B., White, B., Kelly, J. 2010. In Osterhuber, R. and Ferrari, M. (eds.), A conceptual model of avalanche hazard. Proceedings of the 2010 International Snow Science Workshop in Squaw Valley, California, USA, 686.
Wassermann, E., Wicky, E. 2003. Lawinen und Risikomanagement. Edition Filidor, Reichenbach, Switzerland, 60 pp.
Wilhelm, C. 1998. Quantitative risk analysis for evaluation of avalanche protection projects. In Hestnes, E., ed. Proceedings of the Anniversary Conference 25 Years of Snow Avalanche Research, Voss, 12-16 May 1998. Oslo, Norwegian Geotechnical Institute, Publication 203, 288-293
Tags:
avalanche journal
avalanche observations
avalanche research
avalanche types
snowpack tests
Permalink
| Comments (0)
|
|