  
|
Posted By Alex Cooper, Canadian Avalanche Association,
June 3, 2020
|
From volume 88, summer 2007-08
By Dave Gauthier and Dr. Bruce Jamieson
INTRODUCTION
In 2003 Juerg Schweizer and others posed the following important questions for future research: How can field workers test for propagation propensity? Which properties of a slab and weak layer describe the fracture propagation propensity?
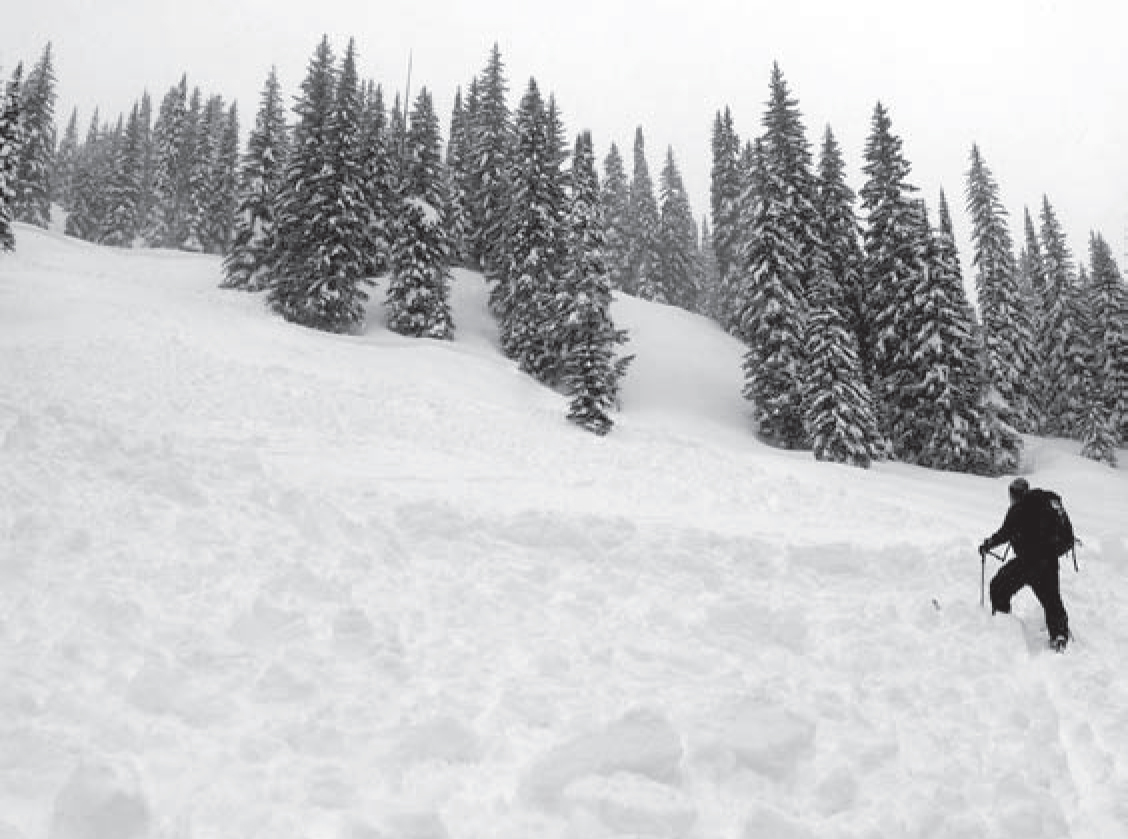
Photo 1: This is a size 3.0 avalanche that we triggered from a safe place 150 m away in February 2007. Propagation propensity was clearly very high here, and we didn’t need a field test to observe it!
In this article, we’re reporting on three years of work at the University of Calgary (ASARC) spent trying to answer the first question: How can we test for propagation propensity in the field? One of the main objectives of this work was to develop and verify a practical testing method, one that was intuitive, easy to do, easy to interpret, and could provide practitioners with specific information about the fracture propagation propensity of any slab-weak layer combination. Photo 1 shows a case of very high propagation propensity.
In recent years, we’ve seen some exciting advances towards addressing the propagation problem in field tests. Fracture character, shear quality, and release type observations are becoming widely used and accepted additions to the standard compression test (CT) and Rutschblock test (RB) results, and have been shown to relate to propagation propensity. At the 2006 ISSW, Ron Simenhois and Karl Birkeland presented their “extended column test” (ECT) as a new method specifically designed to investigate propagation propensity in the field. They presented an amazing dataset showing that the ECT was almost perfect in predicting skier and explosive triggered slab avalanches, and the method is already widely used by the American avalanche community.
Each of these new observations and methods use some sort of surface loading or impact (taps on a shovel or a jumping skier) to initiate weak layer fracture, which of course leads to the propagation of that fracture across the test column. Our approach to the problem was to design a test method that didn’t rely on fracture initiation by surface loading. This isn’t a criticism of the CT, RB, or ECT. In fact, we were mostly trying to find a way to separate fracture initiation and propagation in the test column, so that we could focus on the propagation part in our analysis.
We eventually settled on a method that uses an extended column design like the ECT, only oriented parallel to the fall-line, with the fracture initiated by gradually cutting into the weak layer with a regular snow saw. We’re calling it the “propagation saw test” (PST). Aside from making the analysis simpler—in that we could easily separate initiation and propagation in the test results—this method has a further advantage over the others in some cases. With no surface loading, we can test weak layers of any depth in the snowpack (i.e. Photo 2). Where the CT, RB, and ECT are limited to weak layers down 1.0-1.2 m, we have tested weak layers with up to three metre thick slabs. The limitation was only how much digging we were willing to do!
Before reading further, it’s important to remember that we’re not trying to reinvent slope scale instability assessments, or take experience and local knowledge out of avalanche forecasting and decision making. In fact, we’re not even trying to replace the CT, RB, ECT, or any other method in widespread use. We’re simply trying to provide one more tool to help practitioners answer a specific question about a specific part of the avalanche release problem: What will happen once a fracture is initiated in this weak layer? Will it propagate far and wide? What is the propagation propensity of this slab and weak layer combination?
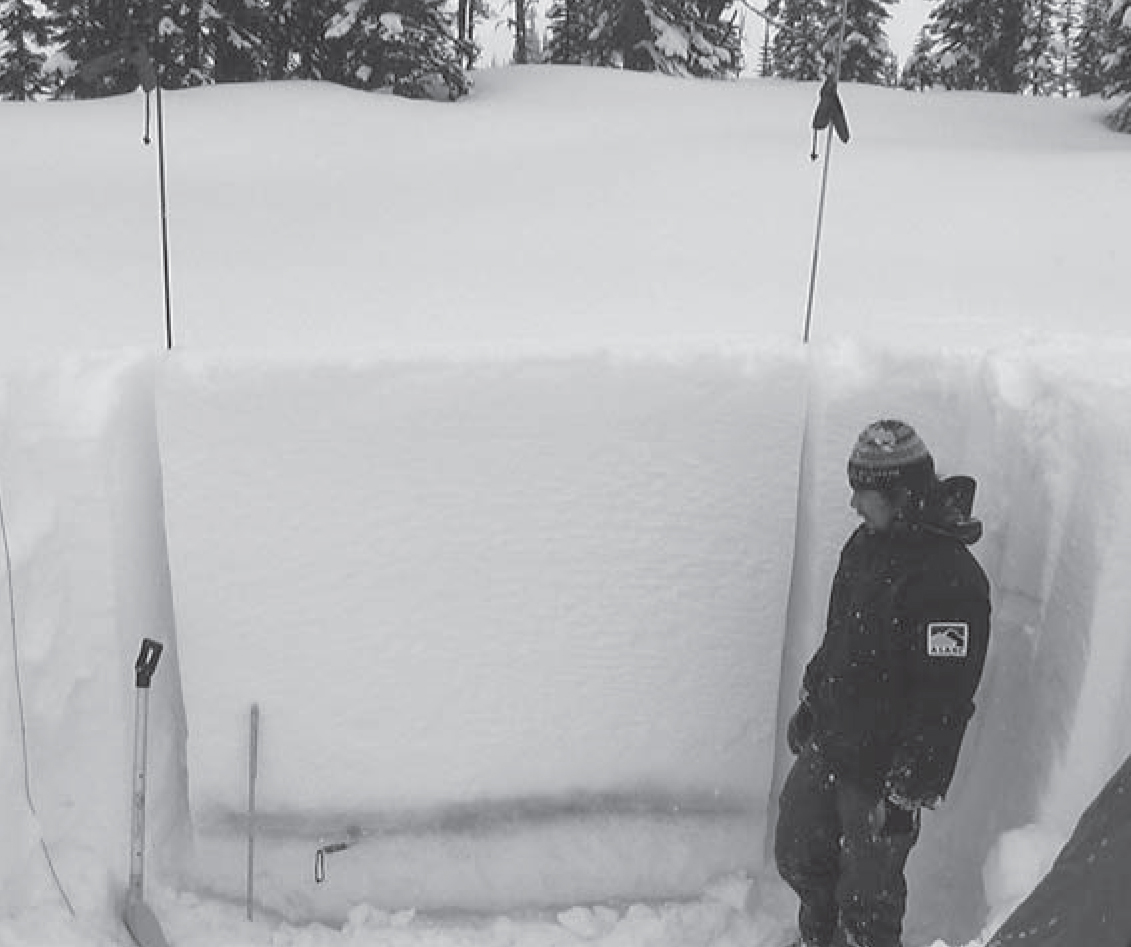
Photo 2: The slab we tested here was over 150 cm thick, and results from testing on this flat terrain were almost perfectly reproducible on nearby slopes. The PST works with slabs of any thickness, but columns like these can take 30-45 minutes to prepare. The three metre thick ones take hours.
TEST METHOD
Terrain/Snowpack/Site Selection
Unlike almost every other instability test, the PST requires that the user choose a specific weak layer to test. Often, local knowledge, experience, or operational objectives determines the layer(s) of most interest for information about propagation propensity, especially for the deep ones. Other times, a fracture line profile, test profile or a CT or RB might identify a weak layer that warrants further investigation. As we already mentioned, there is no real limit to the slab thickness or depth of weak layer that can be tested with the PST, other than the time and effort required to excavate and prepare the test column. It can be very tricky to get a 3m tall column perfectly aligned and shaped to the correct width, and they can tip over and crush you if you aren’t careful.
In developing the PST we spent a lot of time in the field doing experiments to investigate the effects of several variables on test results. In terms of terrain and site selection, we could rarely detect the effect of slope angle on test results. Where there was some slope dependence, it was minor. This means that—spatial variability notwithstanding—we could do a test on the flats at the top of a slope, and get the same results as if we did the test right on the slope. This is an advantage in many cases where you can’t access the start zone safely, or don’t want to dig a huge pit in the middle of a run. Other than the freedom to test any slope angle, and apply the results to adjacent slopes, we recommend the same approach to site selection that you would use for other methods.
Test Columns
Figure 1 is a photo of a fully prepared test column. Like the ECT, we use an extended column design. However, in the PST the column is 30 cm wide across-slope, and 1 m long down-slope. The column must be isolated completely from the surrounding snowpack, to a depth below a weak layer of interest. Note that if the slab is thicker (vertically) than 1 m, the down-slope length of the column should be extended so that it is approximately equal to the slab thickness. A length-greater-than-height geometry is required.
We almost always used a Rutschblock cord and two probes to create the side wall and to isolate the column. It’s a good idea to highlight the weak layer with a soft paintbrush or the back of a glove. This makes it much easier to follow thin weak layers with the saw, and helps identify the softest parts of thicker layers.
Test Method
Once the column is isolated, insert a standard snow-saw completely into the weak layer at the down-slope end of the column, non-serrated edge first. Next, quickly drag the saw through the weak layer towards the upslope end of the column. At some point during the cutting, weak layer fracture will start propagating rapidly ahead of the saw. Stop cutting and keep the saw in place, and try to watch the very rapidly propagating fracture. One of three things will happen:
- the fracture will run all the way up the column to the upslope end and the slab will be completely detached; or
- the fracture will propagate a short distance and stop when the slab fractures (like a crown); or
- the fracture will propagate a short distance and seem to stop for no good reason.
The important observations for interpreting the results of the test are:
1. Did you cut more than half (> 50 cm) or less than half (< 50cm) of the test column when propagation started?
2. Did the fracture propagate the whole way across the column, or did it arrest within the column?
Our verification studies, described in the next section, showed that these two pieces of information (the amount of column that was cut and whether or not the fracture crossed the entire test column) are all you need to say something about the propagation propensity of the slab-weak layer combination.
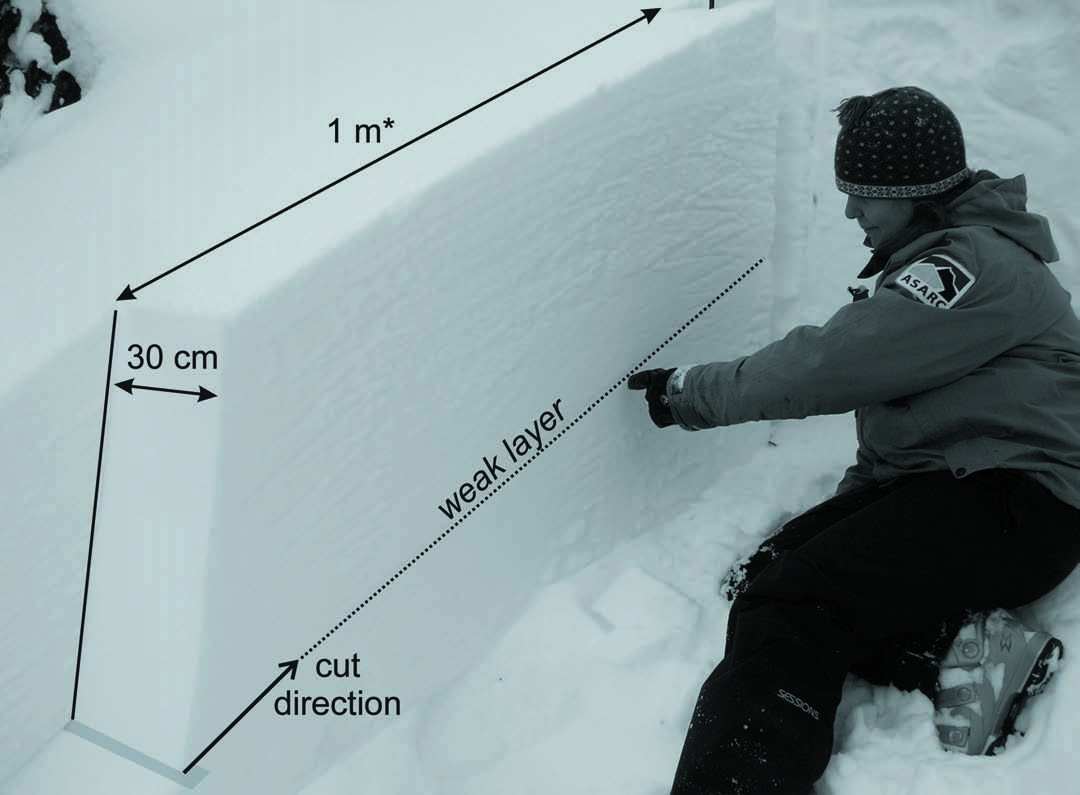
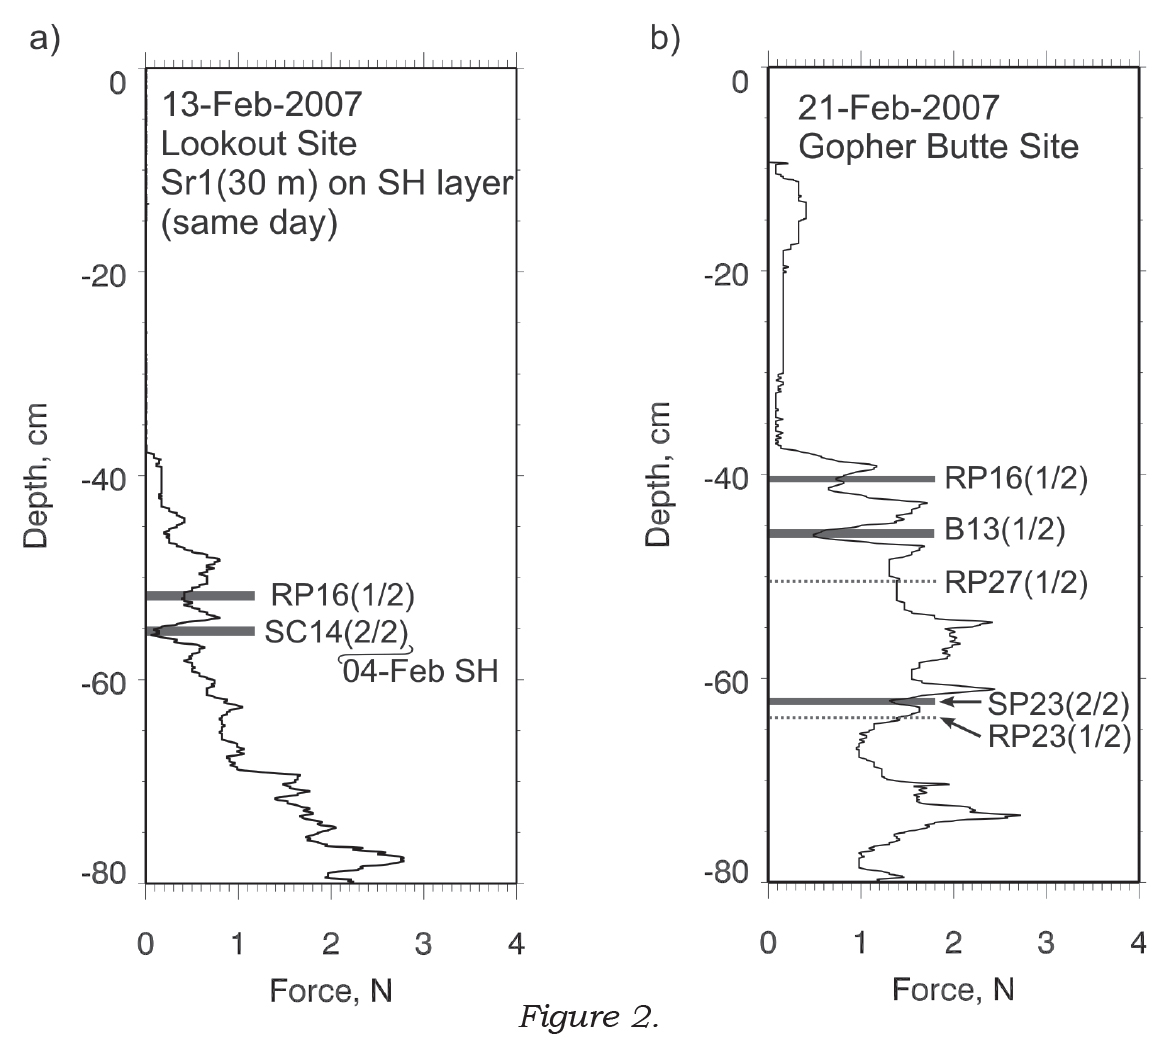
Figure 1: Photo of a propagation test column showing the dimensions and cut direction. We usually prepare the side wall and isolate the column with a rutschblock cord and two probes. Make sure the column is completely isolated from the surrounding snowpack to a depth below the weak layer of interest.
VERIFICATION STUDIES
Method
One of the most difficult parts of this project was trying to figure out a way to “test the test.” The usual approach would be to ski-cut a slope and, based on the results, classify it as stable or unstable, and then compare the field test results with the ski-cut results. For this study, we needed to find a way to observe initiation and propagation separately, and then compare those observations to the field test results.
Of course, when a ski-cut resulted in an avalanche we could say for sure that we had fracture initiation and propagation. On the other hand, when the ski-cut didn’t result in an avalanche, we knew that a fracture hadn’t propagated, but in order to say anything about propagation propensity we needed to know whether or not we had initiated a fracture in the weak layer. If the ski-cut did fracture the weak layer, but it hadn’t propagated, we could say that there is low or no propagation propensity there. However, if there was no initiation we couldn’t say anything about propagation.
Our approach was to dig out the ski tracks in a few places whenever we had no result from a ski-cut, and take a good look at the weak layer to see if we could find evidence of fracture initiation around the skis. This way we had an objective observation of propagation propensity to compare with the test results. Photo 3 is an example of one case where we did find initiation, but not propagation.
Over the course of the 2007 field season, we made observations on 18 slopes with observed initiation and propagation, five with initiation but no propagation, and five with no initiation. Most of our results came from the 4 February 2007 weak layer, although we tested it in many locations around Blue River and Rogers Pass, where it was well-developed surface hoar, and around Kicking Horse Mountain Resort where it was a thin faceted layer.
Results
Propagation likely (if triggered): Our results showed that if less than half of the column was cut when propagation shot ahead of the saw, and the fracture propagated to the end of the isolated column without arrest, fractures—once initiated—were likely to propagate and cause a whumpf or avalanche. In our dataset this prediction was correct every time, provided the test column was the correct length.
Propagation unlikely (if triggered): If we had to cut more than half of the test column when propagation started, or if propagation arrested at slab fractures or for any other reason before reaching the end of the column, we found that weak layer fractures were unlikely to propagate once triggered. These predictions were correct 72% of the time in our dataset. This means that in 28% of cases where the test was predicting low or no propagation propensity, we were right next to skier-triggered avalanches or whumpfs. These “false stable” predictions are particularly dangerous, and it’s very important to understand where and when they might occur.
The false stable predictions in our dataset generally occurred in thinner and softer slabs than the correct predictions. In most of these cases the compression test and Rutschblock test predicted the unstable conditions correctly. Therefore, it’s very important to be cautious when interpreting the propagation saw test results in thin and soft slabs, especially soon after the weak layer is buried and the layer is just becoming active.
Comparisons
At each test site, we always did two or more compression tests and observed fracture character, usually did a Rutschblock test and observed release type, and always did a detailed profile and calculated Yellow Flags for the slab and weak layer. We then used the standard interpretation rules for predicting skier-triggering with these methods, and compared them to the predictions of the propagation saw test and our observations of initiation and propagation on the slope. We weren’t trying to determine which one is the best instability test, but we were trying to understand which one was giving the best information about the propagation part.
Our results showed that the propagation saw test was just slightly better overall, but had many more false stable predictions than the other methods. However, the standard methods had many more false unstable predictions. The standard methods often overestimate instability, because they are testing initiation and propagation, whereas the saw test captures the propagation part better. When we analyzed only the cases of observed initiation with and without propagation, the saw test performed better than the other methods, mainly because it was much better at predicting “no propagation” than the other methods. In a nutshell we found exactly what we hoped for: the propagation saw test is not a replacement for the more traditional instability tests, but it is providing some information about the propagation part of the avalanche release process that the other methods are missing.
One further advantage worth mentioning again here is that the propagation saw test works well for weak layers buried at any depth in the snowpack. The other methods are usually limited to the top 1 m or so, where they are very accurate and where human triggering is most likely. The saw test may be most useful for following a lingering layer long after burial and determining whether or not it is a still a concern, to help answer the “What will happen if I find a thin spot and trigger this layer?” question.
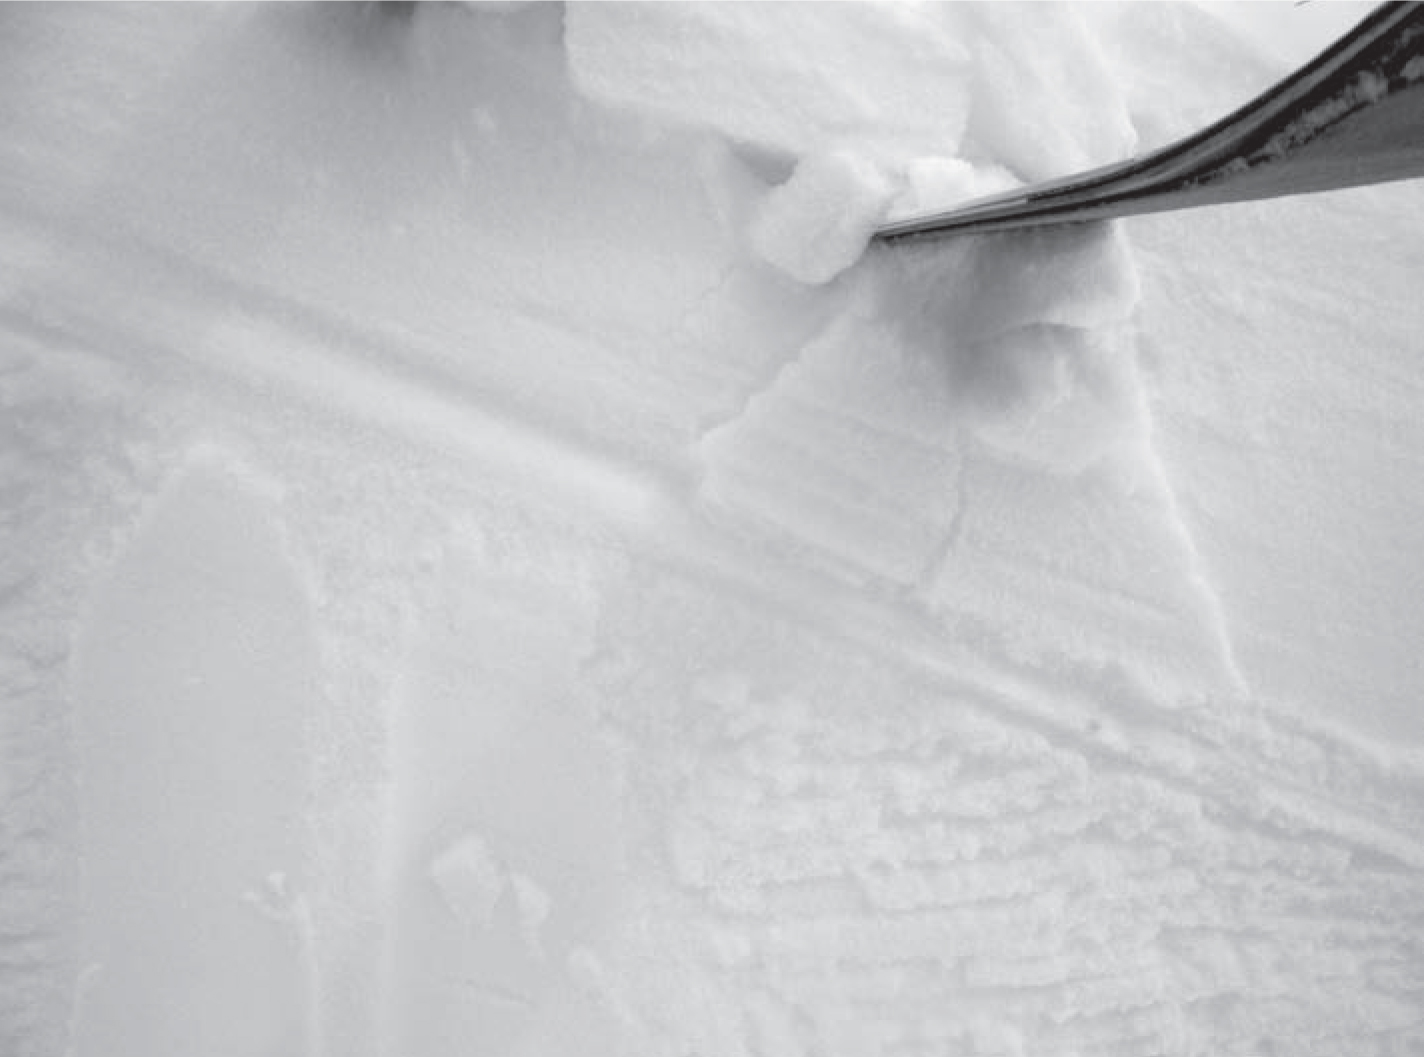
Photo 3: This is an example of excavated tracks from a ski cut where the skier did initiate a weak layer fracture beneath their skis, but the fracture didn’t propagate to release an avalanche. In this case the propagation propensity would be low, even though triggering was easy.
CONCLUSIONS
In summary, the Propagation Saw Test (PST) seems to be able to replicate propagation behaviour likely to be found on nearby slopes. Lots of fracture propagation in the test column, without arrest or interruption, means that propagation propensity is probably high in that snowpack. The test isn’t really providing any useful information about how easy or difficult it might be to initiate or trigger a weak layer fracture, but what might happen if it’s triggered. Remember to use caution interpreting the test results in thin or soft slabs, and that this test is only a tool to help answer a very specific question about the snowpack.
We hope that many professionals will give the PST a try this winter, and we welcome any feedback or comments from anyone. For more detailed information about this project, you can download Dave’s thesis from the ASARC Website (www.ucalgary.ca/asarc). Beware that reading it may result in severe boredom and drowsiness.
AUTHOR INFO
Dave Gauthier, Dept. of Civil Engineering, University of Calgary, davidmgauthier@gmail.com
Bruce Jamieson, Dept. of Civil Engineering, University of Calgary, bruce.jamieson@ucalgary.ca
Tags:
bruce jamieson
dave gauthier
propagation saw test
snowpack tests
Permalink
| Comments (0)
|
|
|
Posted By Alex Cooper, Canadian Avalanche Association,
February 12, 2020
|
From volume 86, fall 2008
By James Floyer

INTRODUCTION
High resolution penetrometer technology has been around for a while now. The first analogue instrument was made in the 1970’s (Bradley’s resistograph) and a digital version was made a decade later (Dowd and Brown’s digital resistograph). Over the years a handful of instruments have appeared, hoping to lure practitioners into plunging probes into the snow and wean them off the laborious habit of digging pits. Although there still seems to be a lot of enthusiasm surrounding penetrometer technology, in practice the luring and the weaning just hasn’t happened yet.
While these fancy instruments have excited researchers with their ability to objectively and rapidly measure snowpack properties (most that have been produced measure hardness, some measure density), there are some good reasons why snowpack penetrometers have not found their way into everyday, mainstream snow assessment practices. One reason is cost. Personally, I don’t put too much store on this, as I firmly believe that people would be willing to pay quite a bit of money for an instrument if it made the task of assessing snowpack stability faster and/or more certain. Instead, I believe the more important reason is that we haven’t yet figured out how to reliably identify weak layers of interest (critical weak layers) from the penetrometer signals.
The study summarized here (see Floyer (2008, pp. 129-151) for a more detailed account) makes a step towards the goal of detecting critical weak layers by relating the shape of the penetrometer signal at a weak layer to the fracture character of that weak layer determined from a nearby compression test. Using the premise that weak layers that fall into the sudden fracture character category can be considered of critical interest, a scheme is presented that allows for this discrimination to be made. The scheme does require the weak layer to be pre-identified, so essentially this scheme is a method for determining the importance of a weak layer that has already been defined. At the University of Calgary, we have also been making progress towards weak layer detection, but for now, I’ll focus on the fracture character study.
METHOD
The penetrometer profiles for this study were collected using a modified SABRE penetrometer (Mackenzie and Payten, 2002) manufactured by Himachal Safety Systems. This manually driven instrument records force-resistance with depth at a frequency of 1000 Hz. The analytical techniques used here could readily be applied to data collected using other digital force-resistance penetrometers.
Compression tests were carried out in close proximity to the penetrometer profiles and the fracture character and depth of each fracture was recorded. In total, 78 penetrometer profiles and 56 compression test results were collected from 28 different site-days and 16 unique sites during the winter of 2007-2008. A typical test configuration is shown in Figure 1.
From the penetrometer profiles, weak layers (with thickness) or interfaces (with no thickness) were manually identified in the penetrometer signals using the depth information from the compression test results. Due to inaccuracies in the depth information associated with both penetrometer and compression test measurements, the weak layer/interface was interpreted in the penetrometer signal up to ±2 cm from the depth recorded in the compression test. Two examples of interpreted penetrometer pushes are shown in Figure 2. Fractures in very low resistance snow could not be identified, due to the SABRE penetrometer’s inability to measure fist resistance snow.
In total, 83 weak layers/interfaces (hereafter referred to as weak layers) were identified in the penetrometer signals. Of these, 41 were resistant planar fractures, 20 were sudden collapse, 14 were non-planar breaks, seven were sudden planar, and 1 was a progressive compression. Due to the low numbers of sudden planar and progressive compression fractures, it was decided to combine the classes into sudden fractures (sudden collapse and sudden planar) and others (resistant planar, non-planar breaks and progressive compression); this grouping reflects the higher incidence of skier-triggered avalanches associated with sudden fractures (van Herwijnen and Jamieson, 2007).
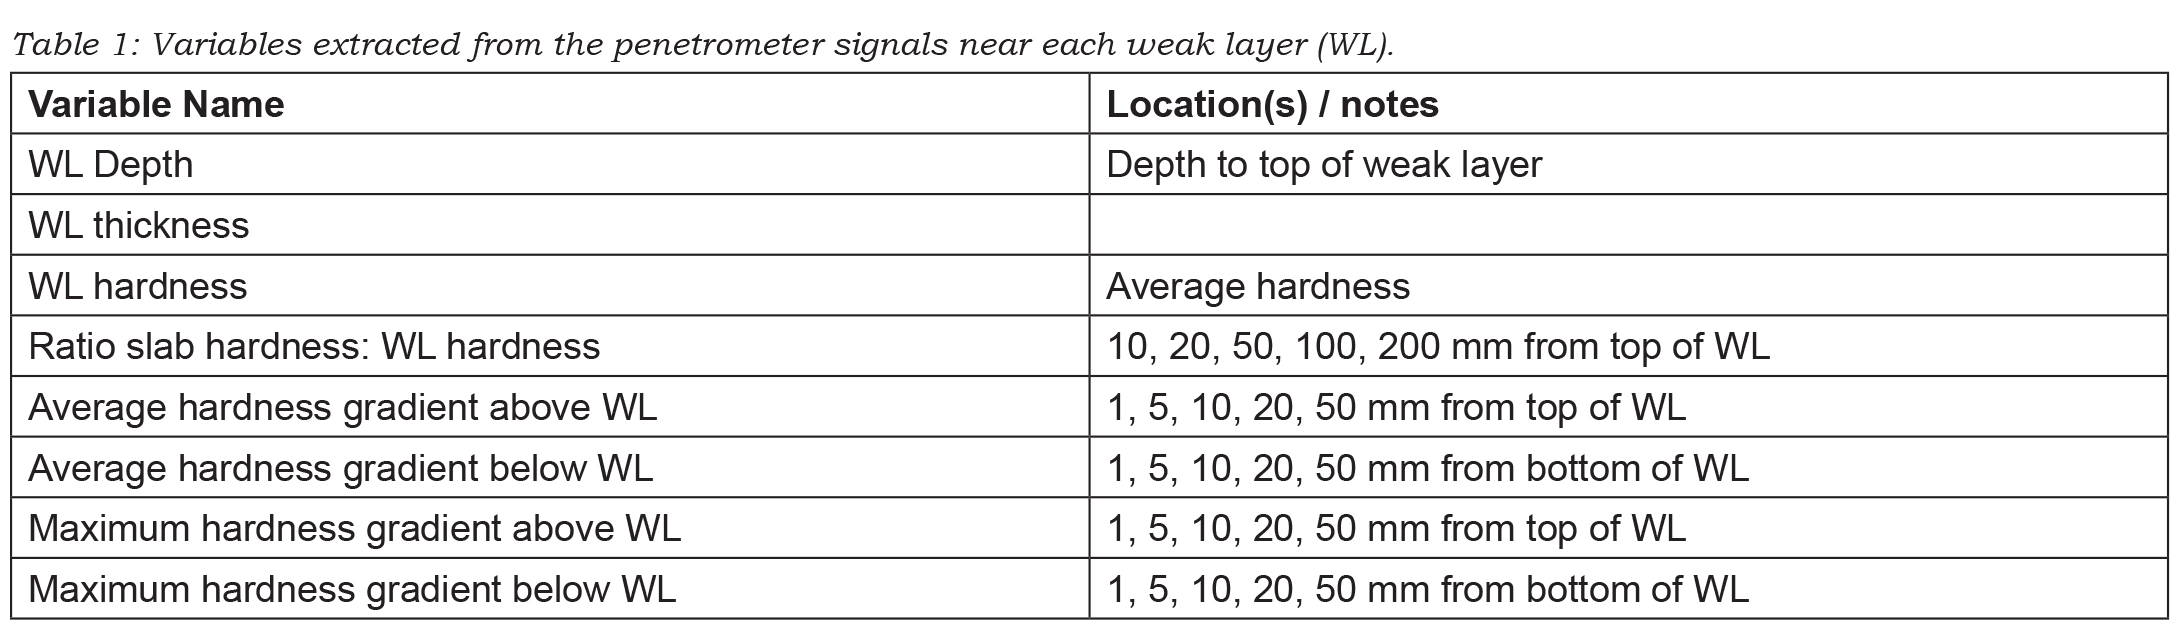
A number of variables were extracted from the penetrometer signals associated with and surrounding the interpreted weak layers. These variables are shown in Table 1. Some of the variables were tested at a number of different distances away from the top and bottom of the weak layer, since, for these variables, the optimum distance from the weak layer was unknown.
A univariate analysis was used to determine the variables that showed the greatest amount of difference in the signals associated with sudden and other groups of fractures. The best variables from the univariate analysis were selected for inclusion in a linear discriminant analysis. Discriminant analysis provides further information on the power of the variables to discriminate between the sudden and other groups, as well as giving a scheme for combining the variables and classifying the penetrometer signal into the sudden and other group.
RESULTS
The variables selected from the univariate analysis for inclusion in the discriminant analysis are shown in Table 2. The second column in this table shows the factor structure coefficients from the discriminant analysis, which gives a measure of the relative importance of each variable for discriminating between the sudden and other fracture character groups.
From the discriminant analysis results, weak layer thickness contributes the most to group separation, with thick layers selecting for sudden fractures. This has an intuitive explanation that thick weak layers are associated with sudden collapse fractures, which, in this analysis, account for the bulk of the sudden fractures. The variable with the second greatest contribution to group discrimination, maybe surprisingly, is the maximum hardness gradient up to 5 mm below the weak layer. For this variable, the absolute value for the maximum was used, so the positive value means that a greater maximum hardness gradient selects for sudden fractures. The average hardness gradient 20 mm below the weak layer also contributes to discrimination, although to a lesser extent. These two variables combined indicate that a stiffer substratum may favour sudden fractures.
Both the average gradient and the maximum gradient 20 mm above the weak layer also contribute to group separation, with factor loadings of -0.42 and 0.32 respectively. The negative value for the average gradient is associated with the negative average gradient values above the weak layer (generally a decrease in hardness with an increase in depth); so a higher negative value still indicates that higher values are associated with sudden fractures. These variables relate to the generally accepted view that a stiffer layer of snow above the weak layer is important for fracture propagation (van Herwijnen and Jamieson, 2007).
The discriminant function built using standardised function weights (not shown, see Floyer (2008, p. 164)) was used to classify the weak layer/interfaces identified in the penetrometer signals into sudden or other fracture character groups. Using a leave-one-out cross-validation method, 77.8% of sudden fractures were correctly classified and 81.5% of other fractures were correctly classified. The overall prediction rate was 79.6%. Classification parity was good between the two groups.
SUMMARY
A method for predicting the broad fracture character group (sudden or other) from penetrometer signals has been developed, based on a multivariate statistical analysis of penetrometer signals interpreted against fracture character results from nearby compression tests. Using a leave-one-out cross-validation method, overall classification rates of approximately 80% were achieved. Weak layer thickness, maximum hardness gradient 5 mm below the weak layer and the average hardness gradient 20 mm above the weak layer contributed the most to discriminating between the two groups.
Results for the sudden category were likely biased towards sudden collapse fractures, which dominated the data set used in this study. More observations are necessary to be able to distinguish between sudden collapse and sudden planar fractures in the sudden category, as well as between the resistant planar, progressive compression and non planar break fractures within the other category. There are also concerns over the subjective nature of the penetrometer signal interpretation, although this was mitigated by setting limits on the window in which the weak layer could be identified.
These results are promising, since they indicate that weak layers may be classified on the basis of fairly simple parameters extracted from the penetrometer signal. If combined with layer detection methods and possibly micro-structural information from higher resolution penetrometers (such as the SnowMicroPen), we move closer to the possibility of automated critical weak layer detection from penetrometer signals.
ACKNOWLEDGMENTS
I would like to thank Bruce Jamieson, who supervised my degree at the University of Calgary. I would also like to thank the entire ASARC crew, the staff at a great number of operations in BC and AB, and the various financial supporters of the ASARC program.
REFERENCES
Floyer, J. A., 2008. Layer detection and snowpack stratigraphy characterisation from digital penetrometer signals, (Ph.D. thesis), Dept. of Geoscience, University of Calgary, Calgary, Canada.
van Herwijnen, A. and B. Jamieson, 2007. Fracture character in compression tests, Cold Regions Science and Technology, 47(1-2), 60–68.
Mackenzie, R. and W. Payten, 2002. A portable, variable-speed, penetrometer for snow pit evaluation, Proceedings of the International Snow Science Workshop (2002: Penticton, BC), 294–300.
Tags:
james floyer
penetrometer
snow profile
snow science
snowpack tests
Permalink
| Comments (0)
|
|
|
Posted By Alex Cooper, Canadian Avalanche Association,
January 29, 2020
|
From volume 96, spring 2011
By Bruce Jamieson, Dept. of Civil Engineering, Dept. of Geoscience, University of Calgary, Calgary AB, Canada
Jürg Schweizer, WSL Institute for Snow and Avalanche Research SLF, Davos, Switzerland
Grant Statham, Parks Canada Agency, Banff AB, Canada
Pascal Haegeli, Avisualanche Consulting and Simon Fraser University, Vancouver BC, Canada
ABSTRACT
At the 2004 ISSW, Roger Atkins proposed that—early in the terrain selection process—backcountry travellers could identify which types of avalanches were likely, e.g. wind slab, persistent slab, wet avalanche. These avalanche types are analogous to a set of scenarios in traditional risk analysis. Variations on Atkins’ approach have been incorporated into some public bulletins. The types of avalanches that dominate the danger ratings are called Avalanche Types/Characters/Threats/Concerns/Situations/Problems by different groups. The latest Swiss brochure for recreation in avalanche terrain suggests different observations for the four different types of avalanche situations. To help determine which observations are best for which types of avalanches, a field study was conducted in the winters of 2008-09 and 2009-10 in the Coast Mountains, Columbia Mountains, and Rocky Mountains of western Canada. On each field day, an experienced field team rated the local avalanche danger, identified two dominant avalanche types and observed a standard set of over 20 quick field observations. The quick observations included avalanches, wind transported snow, snowfall, etc. For correlation analysis, we focussed on two distinct classes of avalanche types: 1) persistent slabs, and 2) wind slabs combined with storm slabs. While some observations correlated with the local danger when either class of avalanches dominated the danger rating, other observations correlated best when only one of these two classes dominated the local danger rating. These results may help bulletin writers recommend that recreationists focus on certain local observations for better informed decisions.
INTRODUCTION
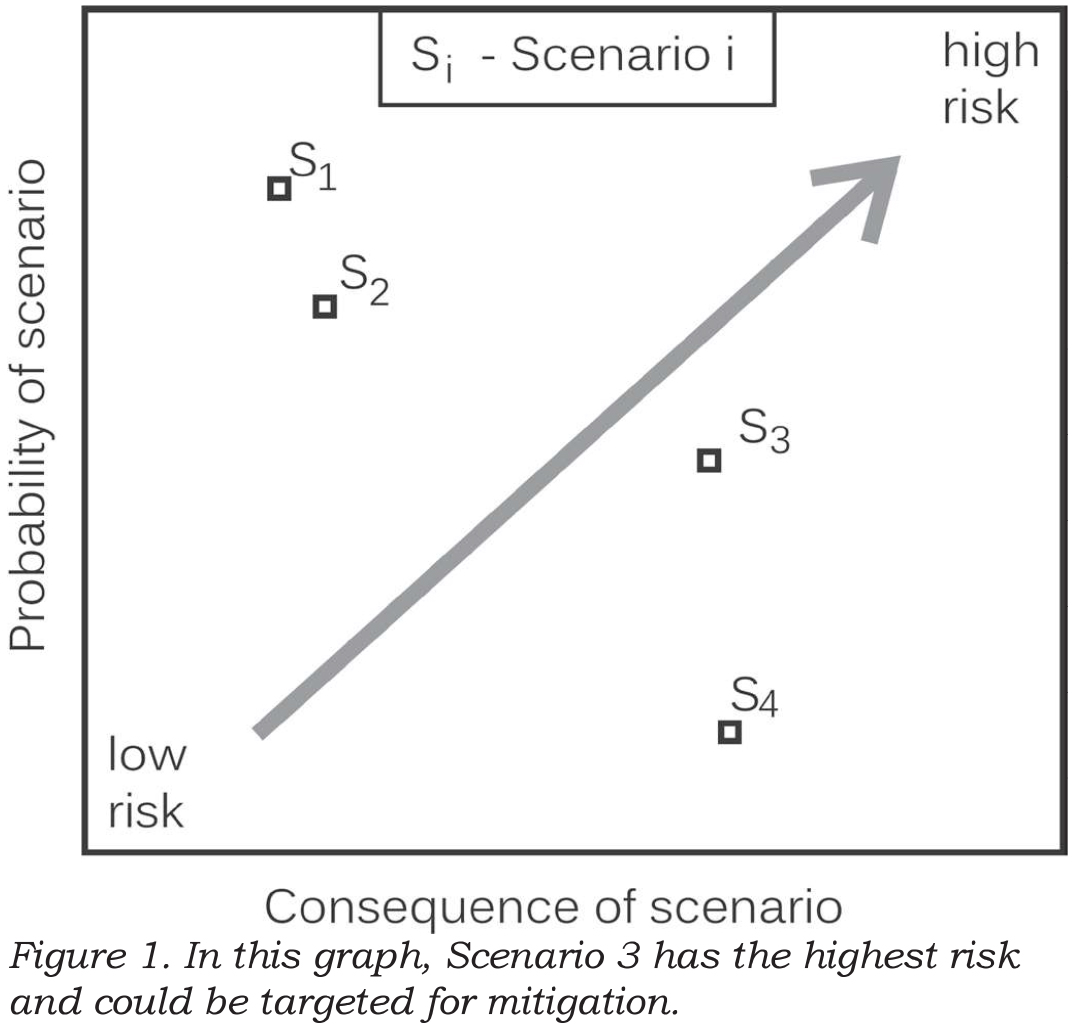
For decades, risk analysts for natural hazards have identified distinct scenarios (or potential events) which threaten something of value e.g. property or infrastructure. For each scenario, the probability of the natural event affecting the thing of value and the expected consequences are estimated (Kaplan and Garrick, 1981). Mitigation, if required, typically focuses on the scenarios with the highest risk (combination of probability and consequences). If the probability and consequences for each scenario can be quantified, the risk for the can be graphed as in Figure 1. If either the probability or consequence can only be ranked (not quantified), the scenarios are usually presented in a risk matrix (e.g. Ahrens, 2008, p. 22-24). The scenarios with the highest risk (or unacceptable risk) can be targeted for mitigation. This established approach to risk analysis has been used for long-return period avalanches that can affect property (e.g. Wilhelm, 1998). The same concept is also used informally by guides, forecasters and experienced recreationists, who often focus on one or two types of avalanches (scenarios) when assessing the risk on the terrain being considered for the current day.
For many years some Swiss guides and avalanche educators have proposed asking: “What is the main danger today?” On most days, it can be decided whether it is either a New Snow, and Old Snow, or a Wet Snow situation.
Once the situation is recognized, the mitigation strategy can be adapted (Wassermann and Wicky, 2003). Stephan Harvey has further formalized this approach, called it pattern recognition and added one more situation: Wind Driven Snow, when an increased avalanche danger often prevails (Harvey, 2008).
In parallel with the Swiss development of Avalanche Situations, at the 2004 ISSW in Jackson Hole, Roger Atkins proposed that the probability and consequences be assessed separately for different types of avalanches, e.g. wind slab, persistent slab, wet avalanche, so the decision makers could focus on the one or two scenarios (Avalanche Types) that posed the greatest risk. Some of his avalanche characteristics incorporated terrain, e.g. wind slabs near ridge tops.
Atkins’ concept was used by the Avalanche Danger Scale Project, which was a Canada-US part of the multi-agency project called Avalanche Decision Framework for Amateur Recreationists 2 (ADFAR2). Starting in 2005, the committee of mostly forecasters took a fresh look—actually fresh look after fresh look—at the forecasting process. When they finally had a consensus, the Avalanche Type was a key component of their conceptual forecasting model (Statham et al., 2010). Definitions for the different types of avalanches have been developed. These definitions were the basis for incorporating Avalanche Problems into Canadian avalanche bulletins (Klassen, 2010).
Most recently, Avalanche Type been used as the central theme in a field book for decision-making in avalanche terrain published by the Canadian Avalanche Centre (Klassen et al., 2010). The field book contains templates for recording the relevant observations and facilitates decisions when preparing for and travelling in avalanche terrain.
The concept of Avalanche Type has been and will continue to be applied at various scales. At the slope scale, experienced forecasters and guides can visualize certain types of potential avalanches on the terrain. At the regional scale, some avalanche forecast centres have started to use one, two, or occasionally three Avalanche Types in their public bulletins. Although there is as yet no consistent terminology (Table 1), the concept has caught on and is now used in various applications.
When updating the popular Swiss avalanche awareness brochure “Caution – Avalanches!” the idea of Avalanche Situations was merged with the reduction method with the classical 3x3 framework (Harvey et al., 2009). For each of the four Avalanche Situations, a number of key observations are proposed to help recreationists focus on the most important observations for the day (Table 2).
Early experience with this scheme suggests that on some days it is difficult to distinguish between new snow and wind driven snow. Also, the debate continues about whether to explicitly recommend digging when old snow is the dominant avalanche situation. On the other hand, the emphasis is not on digging when either new snow, wind driven snow or wet snow is the primary avalanche situation.
The relevant observations for each Avalanche Type in Table 2 are based on experience and an understanding of the processes that form the different types of potential avalanches. Haegeli and Atkins (2010) also present key observations from a survey of experienced avalanche professionals. For this study, we set out to use field data (independent of theory or experience) to identify some key observations when different types of avalanches were dominating the danger rating.

METHODS AND DATA
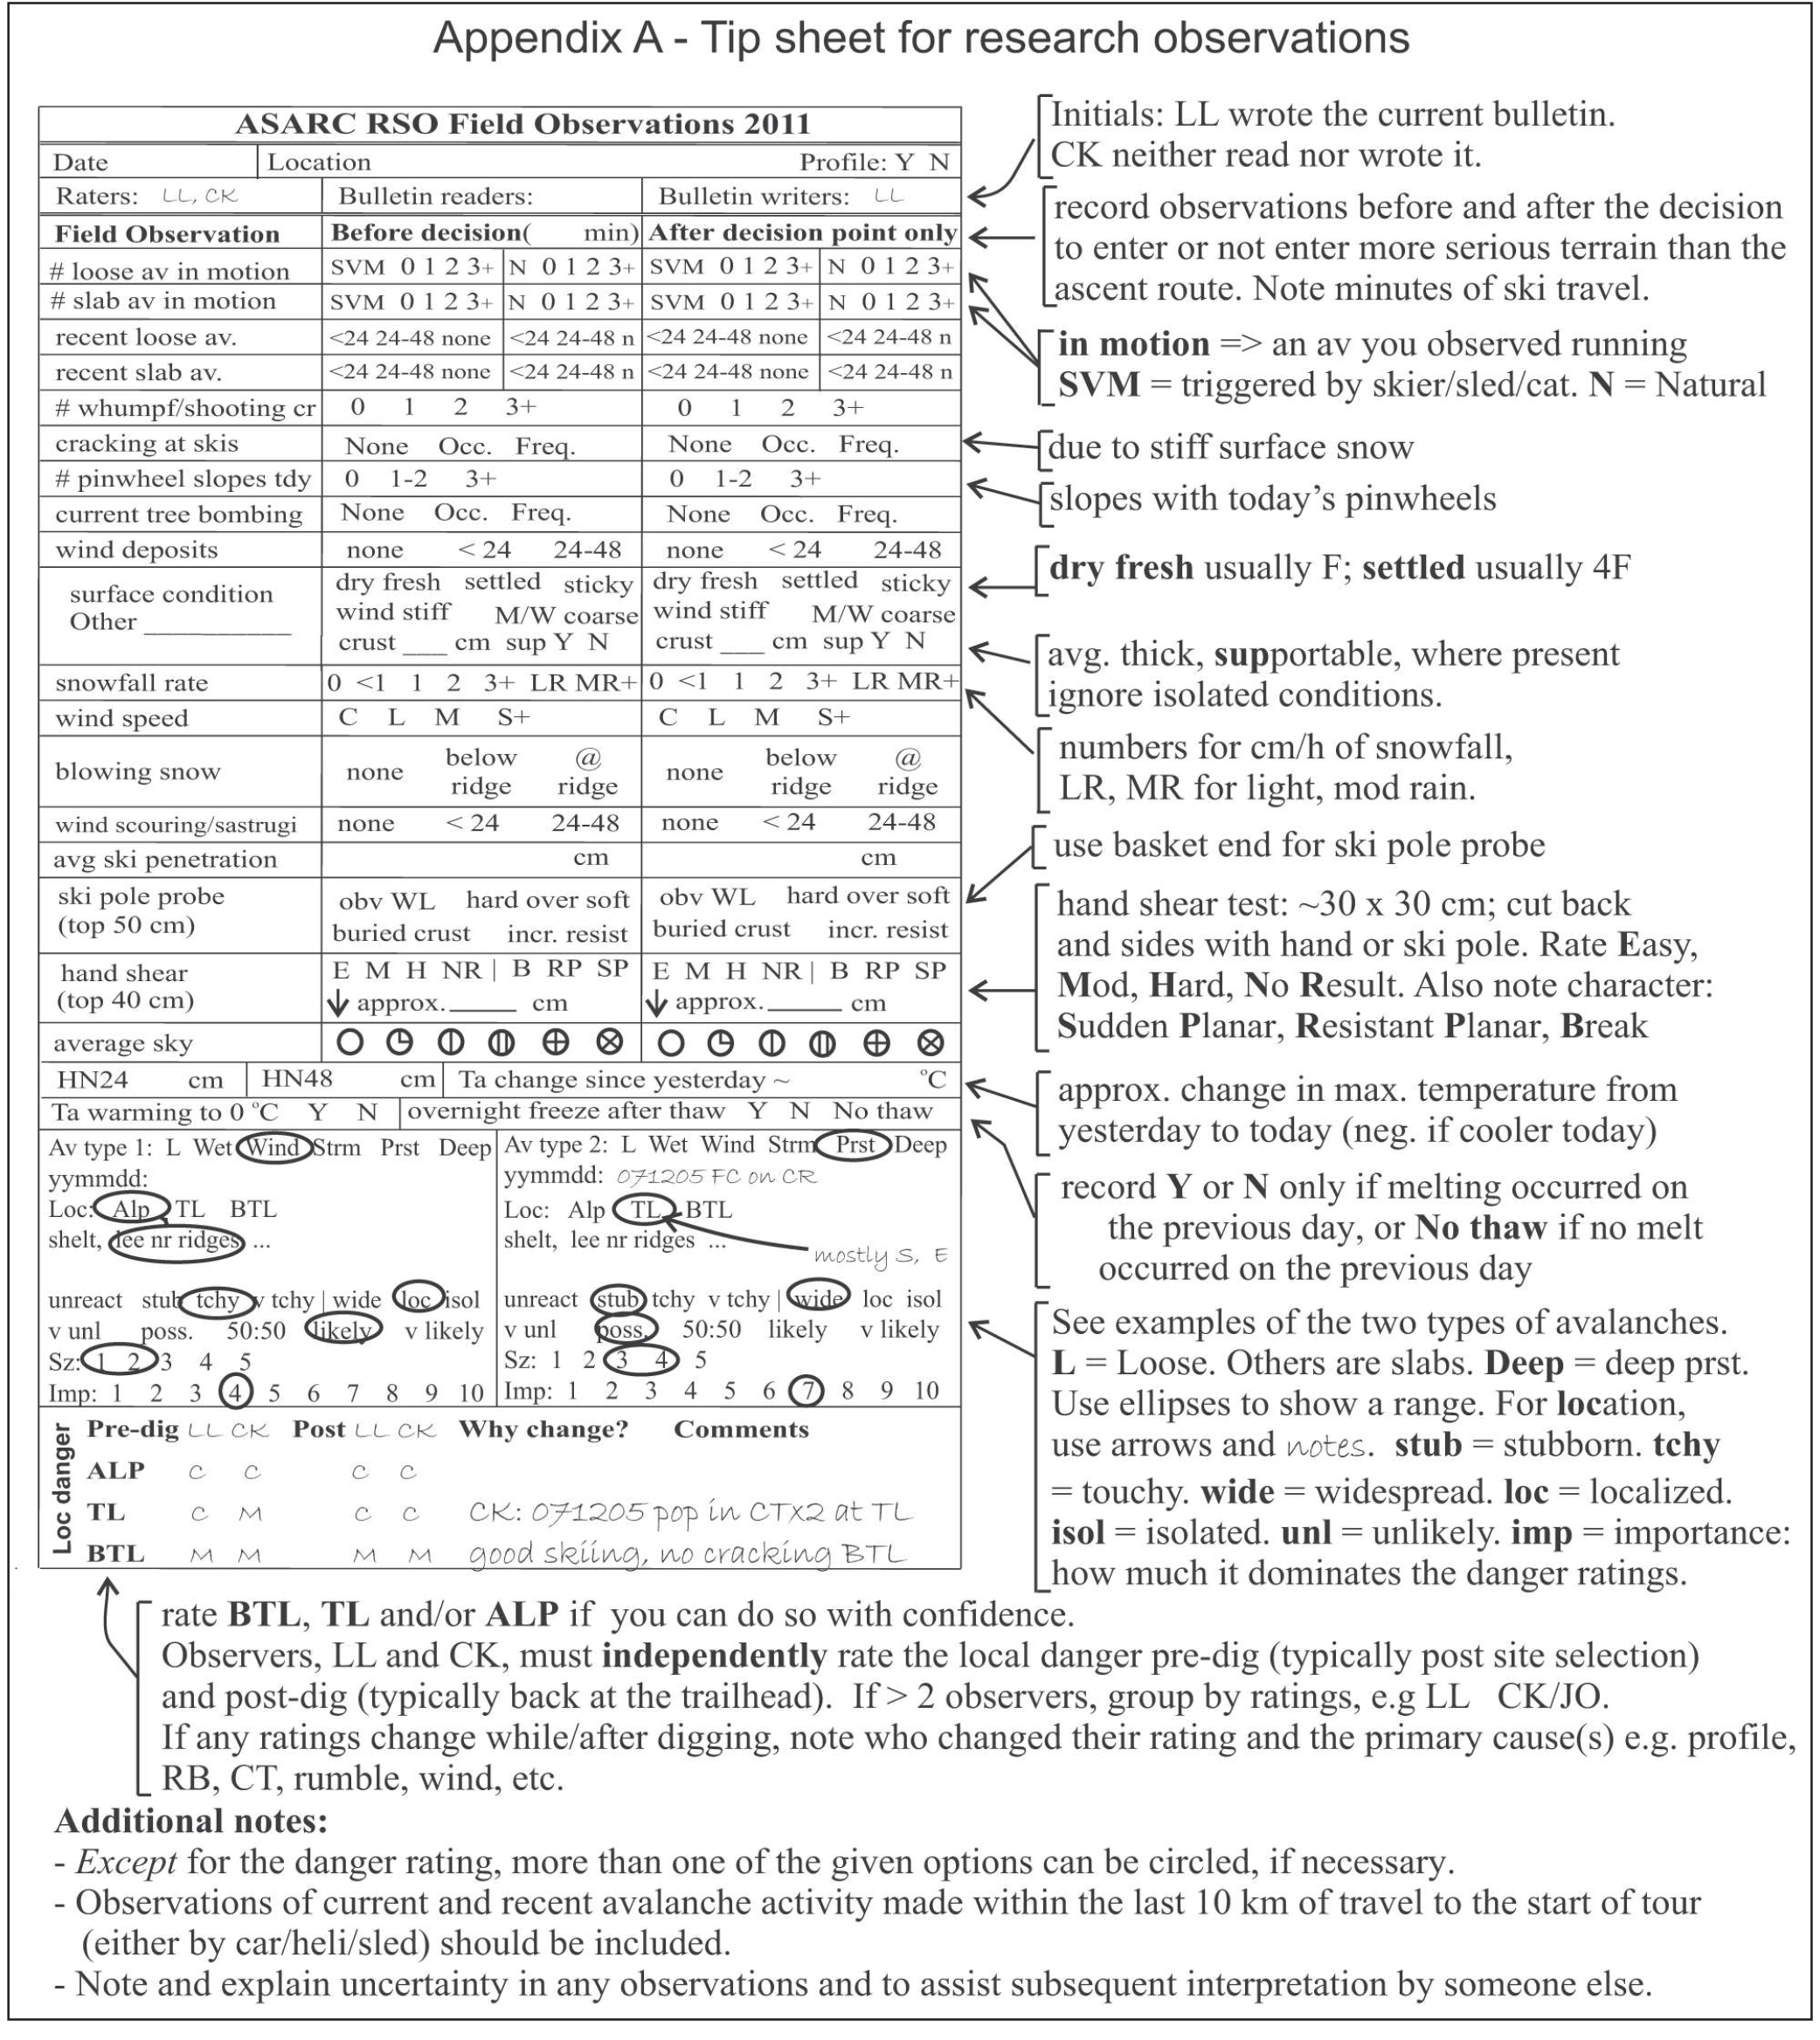
Since the winter of 2007, the Applied Snow and Avalanche Research group at the University of Calgary (ASARC) has been rating the local avalanche danger and making a standard set of over 20 observations (e.g. Jamieson and Haegeli, 2008; Appendix A). Starting in the winter of 2009, we began daily rating the top two Avalanche Types so we could assess which observations were “best” for the various types of expected avalanches. This paper summarizes the results from the winters of 2008-09 and 2009-10.
On most field days in the winters of 2008-09 and 2009-10, ASARC’s field teams in the Coast Range, Columbia Mountains and Rocky Mountains rated the local avalanche danger, made over 20 standard observations (Appendix A), and identified the two most important Avalanche Types (Table 1). For this study we used only the Avalanche Type with the greatest importance—based on its contribution to the danger rating. If the two avalanche types had equal importance (50:50), we used the one recorded as Avalanche Type 1.
Many of the observations were made before and after the decision point, i.e. when the team reached treeline. For each observation, e.g. blowing snow, we used the before or after observation that was more conducive to higher avalanche danger. So, if we observed blowing snow in the morning but not in the afternoon, we used the morning observation.
For most of the observation variables, the specific observation values could be ordered from the least associated with avalanching to the most. For example, the observations for blowing snow were ordered: none, at ridge, below ridge.
Appendix A shows that we rated the local danger for one, two or three elevation zones: below treeline, treeline and alpine. We used the treeline rating, except in four cases in which we did not rate the local avalanche danger at treeline, in which case we used the below treeline rating.
In a few cases in which the precipitation was rain, we treated the precipitation rate as missing. This resulted in the dataset shown in Table 3. Each case is a record of one field team travelling on touring skis in a specific area on a given day.
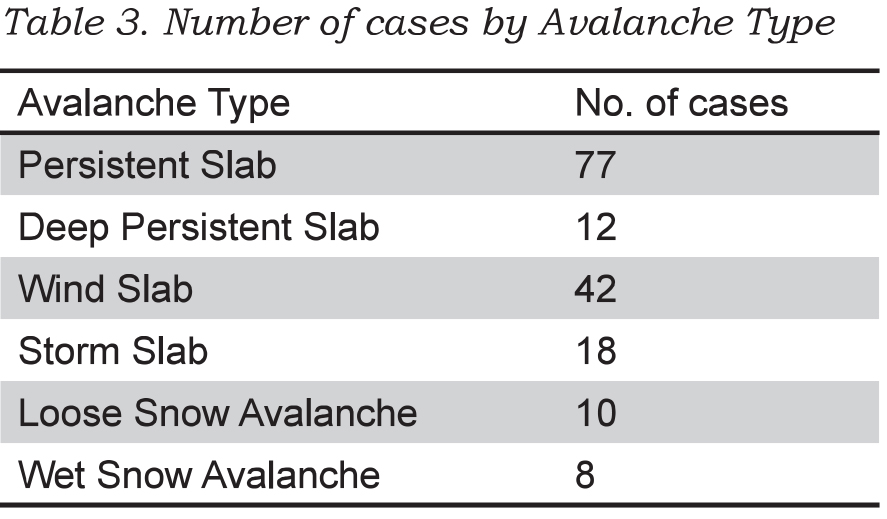
We excluded Loose Avalanche and Wet Avalanche types from the analysis since there were too few cases. Also because of limited cases, we combined Storm Slab with Wind Slab, and combined Deep Persistent Slab with Persistent Slab.
PRELIMINARY RESULTS
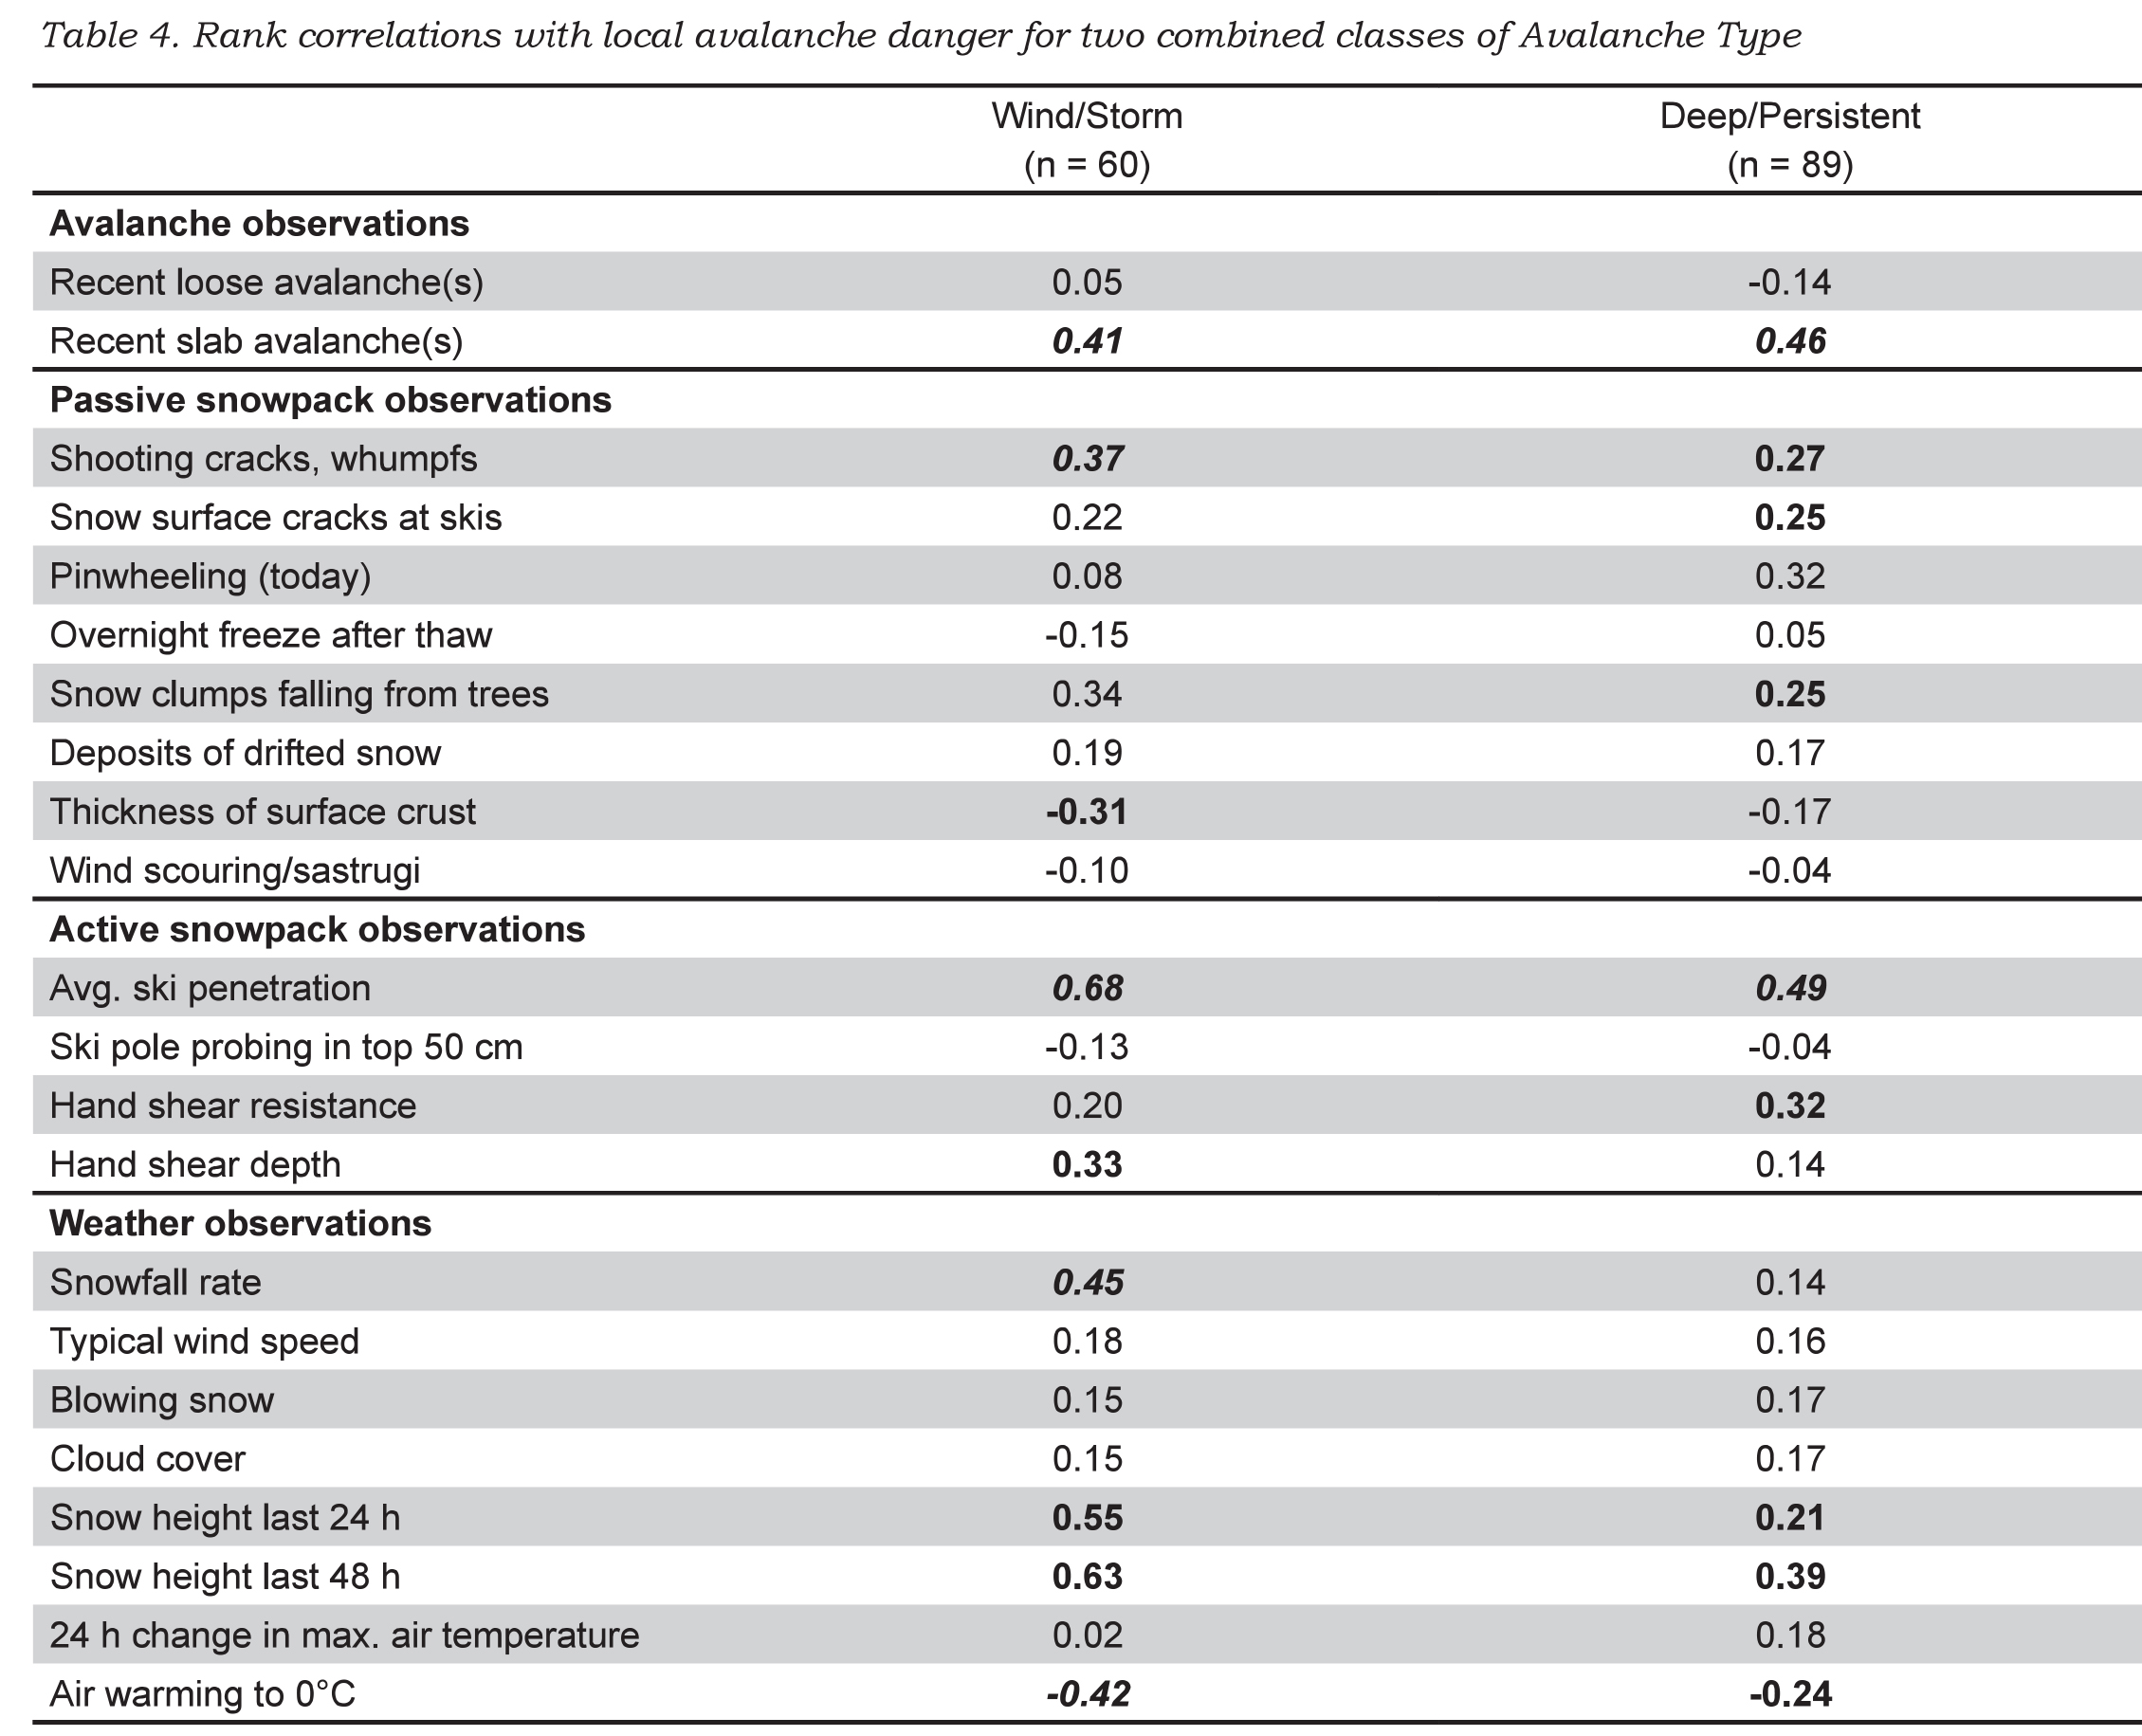
Spearman rank correlations between the local danger rating and the ordered observations are shown in Table 4. Correlations for which p < 0.05 are marked in bold. Correlations for which p < 0.01 are marked in bold italic.
Observations that correlated when either class of Avalanche Type was important?
When either Wind Slab/Storm Slab Avalanches or Deep/Persistent slab avalanches dominated the danger rating, the observations that correlated with the local avalanche danger were: slab avalanches, whumpfs/shooting cracks, clumps of snow falling off trees (tree bombs), deep ski penetration, snow height (snowfall) from in last 24/48 h, and air warming to 0°C (negative) (Table 4). The negative correlation prompted a second look at the data: when the air temperature reached 0°C (usually spring time), the avalanche danger was mostly Low or Moderate.
Observations that correlated when storm snow or wind slabs were important?
In addition to the observations mentioned in the previous paragraph, the snowfall rate, increased hand shear depth and absence of a surface melt-freeze crust correlated with the local avalanche danger when storm snow or wind slabs dominated the danger rating (Table 4). The key variables include the following observations of current or recent snowfall: snowfall rate, accumulated snowfall in the last 24/48 hours, as well as deep ski penetration.
Observations that correlated when deep/persistent slab avalanches were important?
In addition to the observations mentioned for both classes of Avalanche Types, low hand shear resistance, pinwheeling, and snow surface cracking at skis correlated with the local avalanche danger when Deep/Persistent Slab Avalanches dominated the local danger rating.
DISCUSSION
The observations proposed by the Swiss avalanche awareness brochure Caution – Avalanches! (Harvey et al., 2009) and the Canadian Avalanche Centre field book (Klassen et al., 2010) are supported by the correlations in Table 4. For a New Snow Avalanche Situation, recent slab avalanches and new snow amount correlated with the local avalanche danger. For an Old Snow Avalanche Situation, whumpfs correlated with the local avalanche danger. Some correlations, such as the one between pinwheeling and the local danger when Deep/Persistent Slabs are important, are difficult to explain and may not be significant in a larger, more balanced dataset.
For Deep/Persistent Slabs, fewer observations correlated with local danger than for Storm Snow and Wind Slab Avalanches, which is consistent with the greater forecasting challenge for persistent slabs. See also the limited relevant observations in Table 2 for the Old Snow Avalanche Situation.
Research often yields unexpected results. When ASARC’s morning stability evaluation was expanded to include identification of the one or two most important Avalanche Types, one of us (Jamieson) expected the usual response to increased paperwork. Instead, the field staff liked the focus that Avalanche Type provided to the morning safety meeting and has retained it. The Avalanche Type is just one part of the rethinking of the forecasting (Statham et al., 2010) that has become popular with ASARC’s field staff.
SUMMARY
Several regional forecast centres have adopted the concept of Avalanche Character/Type/Threat/Concern/Situation/Problem for use in their public bulletins. This concept is consistent with the scenarios in traditional risk analysis. Harvey (2008) has proposed specific observations for certain classes of Avalanche Situations. For this study, we analysed a dataset of 159 cases (locationdays) in which over 20 observations were made and the local avalanche danger was rated. When the dominant Avalanche Type was either Storm Avalanches or Wind Slabs, the observations that correlated (and were consistent with knowledge of avalanche formation) included recent slab avalanches, snowfall rate, snow clumps falling from trees (usually indicative of wind or warming), deep ski penetration and snow height from the last 24/48 hours. When the dominant Avalanche Type was either Deep Persistent or Persistent Slab, the observations that correlated (and made sense) included recent slab avalanches, whumpfs/shooting cracks, deep ski penetration and increased snow height from the last 24/48 hours.
Further field studies are planned. There are other observations that correlated in this study and may benefit from analysis of a larger dataset. However, any recommended observations should be consistent with the current understanding of the processes that form the different types of avalanches.
ACKNOWLEDGEMENTS
For the careful field work we are grateful to Cam Campbell, Spencer Krkosky, Deanna Andersen, Lydia Marmont, Peter Marshall, Chris Geisler, Ali Haeri, Cameron Ross, Thomas Exner, Mark Kolasinski, Katherine Johnston, Cora Shea, Mike Smith, Dave Tracz and Jordan Stiefvater. Thanks also to Mike Smith for proofreading, to Cameron Ross for checking the data and Dave Gauthier for checking the analysis.
For logistical support for the field studies we thank Mike Wiegele Helicopter Skiing, BC Ministry of Transportation and Infrastructure, BC Ministry of Parks, Parks Canada, the Canadian Avalanche Centre, as well as the Avalanche Control Section of Glacier National Park.
For financial support for the field studies and the first author’s time, we thank the Natural Sciences and Engineering Research Council of Canada, HeliCat Canada, the Canadian Avalanche Association, Mike Wiegele Helicopter Skiing, Teck Mining Company, Canada West Ski Areas Association, the Association of Canadian Mountain Guides, Backcountry Lodges of British Columbia, and the Canadian Ski Guides Association.
REFERENCES
Ahrens, T. 2008. Risk Analysis. John Wiley & Sons, Chichester, England.
Atkins, R. 2004. An avalanche characterization checklist for backcountry travel decisions. Proceedings of the 2004 International Snow Science Workshop in Jackson Hole, Wyoming, USA, 462-468.
Haegeli, P., Atkins, R. 2010. Exploring the ‘It depends’ – How do mountain guides assess avalanche situations? In Osterhuber,
R. and Ferrari, M. (eds.), Proceedings of the 2010 International Snow Science Workshop in Squaw Valley, California, USA, 130-132.
Harvey, S. 2008. Mustererkennung in der Lawinenkunde. In: I. Kroath (Editor), Sicherheit im Bergland. Oesterreichisches Kuratorium für Alpine Sicherheit, Innsbruck, Austria, pp. 88-94.
Harvey, S., Schweizer, J., Rhyner, H., Nigg, P., Hasler, B. 2009. Caution - Avalanches! 6th edition. Avalanche Prevention in Snow Sports, Core team of instructors, Davos, Switzerland.
Jamieson, B., Haegeli, P. 2008. Can field observations be combined systematically with the regional danger rating to estimate the local avalanche danger? Proceedings of the 2008 International Snow Science Workshop in Whistler, BC, 228-237.
Kaplan, S., Garrick, B.J. 1981. On the quantitative definition of risk. Risk Analysis 1(1), 11-21.
Klassen. K. 2010. The Avalanche Hazard Assessment Web-tool – A structured approach to public avalanche forecasting. Presentation at the Spring Conference of the Canadian Avalanche Association, 6-7 May 2010.
Haegeli, P., Atkins, R., Klassen, K. 2010. Decision Making in Avalanche Terrain. Canadian Avalanche Centre, Revelstoke, BC, 62 pp.
Statham, G., Haegeli, P., Birkeland, K., Greene, E., Israelson, C., Tremper, B., Stethem, C., McMahon, B., White, B., Kelly, J. 2010. In Osterhuber, R. and Ferrari, M. (eds.), A conceptual model of avalanche hazard. Proceedings of the 2010 International Snow Science Workshop in Squaw Valley, California, USA, 686.
Wassermann, E., Wicky, E. 2003. Lawinen und Risikomanagement. Edition Filidor, Reichenbach, Switzerland, 60 pp.
Wilhelm, C. 1998. Quantitative risk analysis for evaluation of avalanche protection projects. In Hestnes, E., ed. Proceedings of the Anniversary Conference 25 Years of Snow Avalanche Research, Voss, 12-16 May 1998. Oslo, Norwegian Geotechnical Institute, Publication 203, 288-293
Tags:
avalanche journal
avalanche observations
avalanche research
avalanche types
snowpack tests
Permalink
| Comments (0)
|
|
|
Posted By Alex Cooper, Canadian Avalanche Association,
November 20, 2019
|
From vol. 111, winter 2015
By Colin Zacharias

Conducting an extended column test. Photo by Colin Zacharias
THE WEIGHT OF EVIDENCE
Every winter day we make snowpack observations and extrapolate from observation sites to nearby terrain. Most days, for most avalanche problems, this extrapolation process works and we make key decisions from comparatively few quality bits of information. But it is easy to lose confidence in our abilities when conditions become unfamiliar or our information becomes scarce.
Outside of current avalanching and other alarm signs, and especially during periods of high snowpack variability, experienced observers tend to steer away from drawing quick conclusions from a few snowpack observations. They recognize that one test is just one observation, and to counter possible extrapolation errors they ensure that over the critical timeframe key information is supported and verified.
On the other hand, inexperienced observers may apply too much importance to a persuasive snowpack test result or a single avalanche occurrence and be subject to a confirmation bias. Experienced forecasters, even with a decent amount of information, recognize that at times their best is still in the end just that.
Karl Klassen, Avalanche Canada Public Avalanche Warning Service Manager and mountains guide, recently reminded me with a nice touch of irony that while our data -> information -> knowledge -> wisdom hierarchy (Zeleny 1987) fits into a neat little package, it can also backfire. Depending on the quality and quantity of the data set, its relevancy, and our ability to interpret the info, data isn’t information and information isn’t knowledge, and if one thing is certain, wisdom is a different kettle of fish.
There are times when logistics make it difficult to add weight to the evidence. Poor weather or difficult travel conditions, for example, may prevent access to terrain or study sites. Yet even then assumptions are made and conclusions derived. As Dr. Bruce Jamieson notes in his mountain snowpack presentation for the ITP Level 2 Module 1, “inaccurate assumptions can have serious consequences” when it comes to spatial variability in the mountain snowpack.
Decisions made from a deficit or even partial deficiency of information required to understand the avalanche problem are considered uncertain in light of an applied risk management strategy (as defined by ISO 31000). In the avalanche world we are okay with uncertainty—so long as we know what we don’t know. We understand that as the measure of uncertainty increases so does that long arm of caution when planning to reduce the risk.
In today’s avalanche world in Southern BC and Alberta, professionals rely on a daily information exchange to help manage the complexity of snowpack/terrain variability, to provide a “heads up” early warning system or a nearest neighbor confirmation— “yes, they’re seeing what we’re seeing.” Each day we scan through thousands of bits of data and information on the InfoEx, then go into the field and gather more, aggregate the data into information packets, and analyze and communicate patterns that we refer to as hazard factors.
This article, along with the “How Useful Is the Evidence?” table below, was developed in the fall of 2011 as part of an Avalanche Operations Level 2 Module 3 training course handout to help learners apply the notion of strength and weight to field observations, to use a checklist style verification process, and to encourage quality craftsmanship and a thorough approach when analyzing and discussing snowpack factors. It may help the learner to recognize whether or not their evidence drawn from snowpack tests is helpful to their decisions.
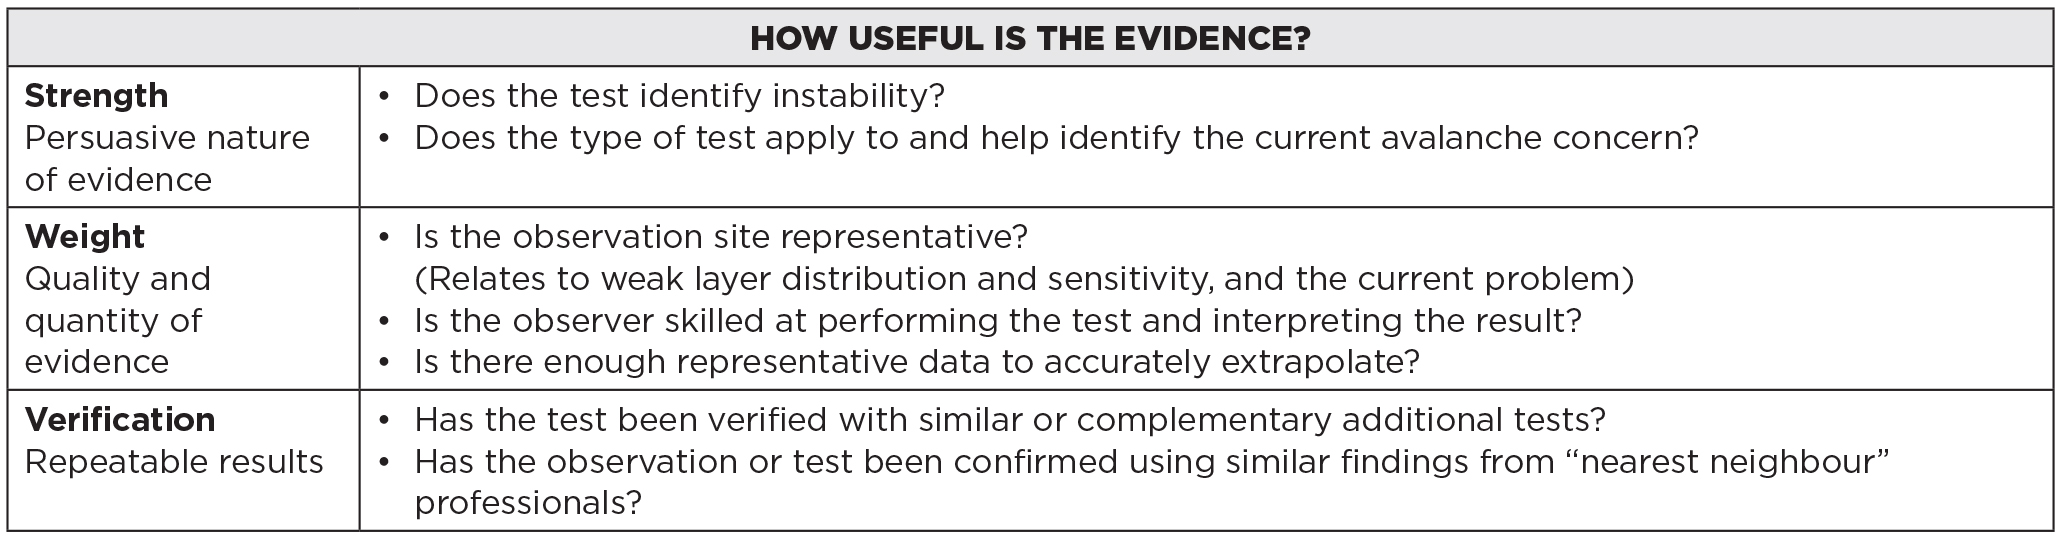
Fig. 1: From CAA Level 2 Module 3 handout
CRAFTSMANSHIP AND CONSISTENCY
“Jeez…. the weather and snowpack vary enough; can’t we all just do the same damn observation the same damn way?”
Regional and operational consistency with technique, application and interpretation ensures the quality of data gathered, recorded and communicated. On professional level avalanche training courses, instructors inform that practice, technique, and a meticulous day-to-day consistency with observations, recording and communication should never be undervalued, nor should the scope of the task be underestimated:
- Ensure that there is an objective for each snowpack test. The early morning safety meeting agenda usually includes assessing the day’s avalanche problem and identifying gaps in knowledge. Know what you’re looking for prior to looking.
- Select relevant sites for field test sites using experience and the seasonal observation of how the snow is layered over the terrain. Once sites have proven their worth, they are repeatedly used season to season.
- Conduct tests skillfully using standardized, practiced techniques. Observers use established guidelines when conducting, recording, and communicating weather, snowpack and avalanche observations; these come from Observation Guidelines and Recording Standards for Weather, Snowpack and Avalanches (OGRS) and Snow, Weather, and Avalanches: Observation Guidelines for Avalanche Programs in the United States (SWAG).
- Ensure consistency within an operation by having employees conduct observations side by side. Discuss technique and compare interpretation during preseason staff training.
THE RIGHT TOOL FOR THE RIGHT JOB
The CAA’s OGRS and the AAA’s SWAG provide guidelines for how to conduct and record weather, snowpack, and avalanche observations. Other than a few comments about the observed limitation of certain tests, these guidelines deliberately offer little information on how to apply or interpret the observations as they relate to an avalanche problem or forecast. This knowledge and proficiency is gained through other means, including research articles, professional avalanche training, and on the job training and mentorship.
Of course there isn’t any single test that will reveal exactly what you need to know about snow. Yet every decade or so it seems that guides and forecasters have a new favourite “go to” decision making aid they default to when investigating the current avalanche problem. First it was the Rutschblock test (RB), then the compression test (CT)—or the other way around depending on your region—and now it’s the extended column test (ECT). In a helpful 2010 article “Which Obs for Which Avalanche Type?” Bruce Jamieson and others conducted a field study that did an excellent job of directing attention to those observations that best identify each avalanche concern. The combination of determining the avalanche problem prior to departure (Atkins 2004) and having a good idea about which field observations and tests will best identify the problem is a good start when choosing the right tool for the right problem.
The AIARE Avalanches and Observations Reference included below (published in the AIARE Field Book and instructor materials) was inspired by the aforementioned article and is a useful field reference to help learners target those concerns described in the daily avalanche advisory.
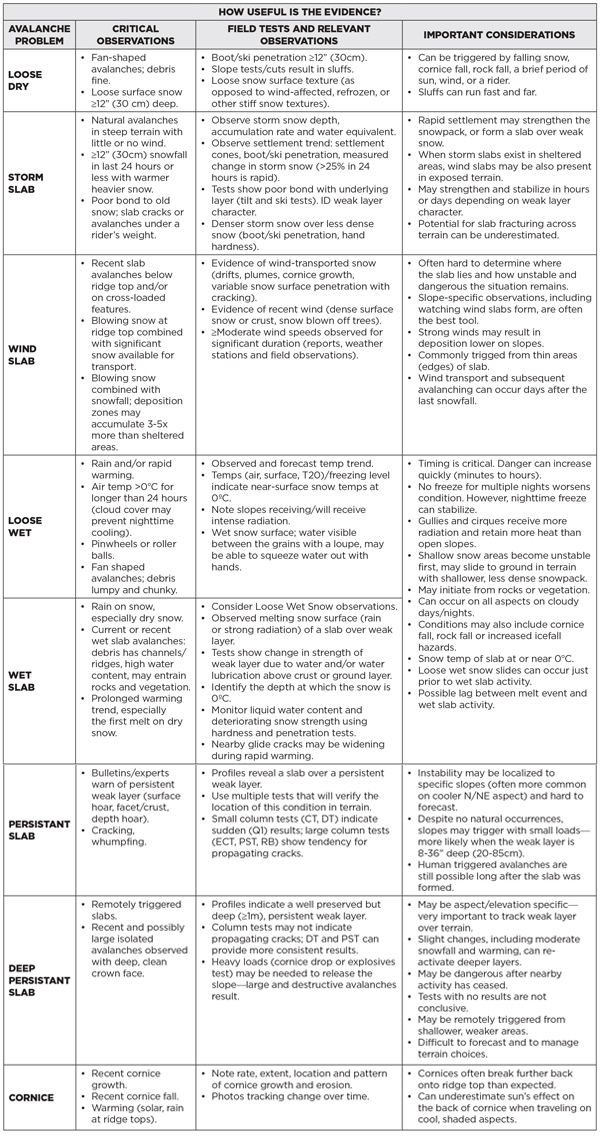
Fig. 2: From AIARE instructor materials and field book, 2012
MANAGING FALSE STABLE AND FALSE UNSTABLE RESULTS
Doug Chabot, forecaster at the Gallatin National Forest Avalanche Center, brings up a good point in a recent blog post: “Snowpit tests are used to show instability, not stability. Never stability. Snow pits (and snowpack tests) do not give the green light to ski; they just give us the red light to not ski. An unstable test result is always critical information. A stable test result does not mean the snow is stable a hundred feet away.”
Chabot’s advice points to the quandary many backcountry recreationists face when analyzing snowpack factors: a test result illustrating unstable snow urges cautious risk reduction, but what does a “no result” mean? Yet estimating where the snow is strong and where the snow is weak is an important skill—particularly for guides committing clients to terrain. Determining stability or the “likelihood that avalanches will not occur” involves a detailed process of gathering evidence, drawing a big picture perspective and not leaping to conclusions from a single observation or test result.
- Knowing the sites that information is coming from, having a systematic or “toolbox approach” to clue gathering (see Fig. 3), and observing the terrain and trends over time are all crucial links in the chain of gathering information and applying it to a hazard analysis. And knowing to what degree those links are missing and then defining the information deficit (whether the uncertainty is weak layer location and distribution, character and sensitivity, or slab characteristic and estimation of destructive potential) is all part of guide and forecaster daily discussion. In addition to the strength, weight and verification checklist provided in Fig. 1, the following points may help when interpreting the day’s investigations.
- A seasonal perspective of where the terrain has historically formed stronger and weaker snow is important. Basal facet development tends to repeat itself in seasonal trends. While near-surface persistent weak layers tend to have a broader distribution, sun or wind effect can result in feature scale variability in weak layer character. For example, DF (decomposed and fragmented snow grain) layers can be unstable locally but may not be problematic on a drainage scale. Expect a higher incident of false stable test results when observing locally unstable layers like DFs, graupel or sun crust/DF interfaces.
- One of the best tools for determining the nature of snowpack variability is to simply observe and memorize how the current snow surface or near surface condition changes over the terrain. Knowing the extent of surface hoar, facet, crust, or graupel formation and the distribution of storm snow and wind redistribution of snow helps to form a baseline when later estimating snowpack strength. Imagine yourself a heli ski guide with the opportunity to travel over 10s or 100s of kilometres of terrain on any given day. Using your eyes, your skis, and a few quick penetration and hand tests provides insight into what to expect when the snow surface becomes a buried weak layer. “Quick tests,” while not subject to the same formal research as standard tests, still provide helpful information to an approximate depth of 45cm (Schweizer and Jamieson 2010).
- A checklist sum of snowpack structural properties (a.k.a. “yellow flags” or the Snowprofile Checklist (Jamieson and Schweizer 2005)) provide valuable clues about which layer interface is most likely to result in a localized failure/fracture. However, as the checklist sum has a tendency to overestimate instability (false unstable=false alarm), further tests are conducted to determine propensity for propagation (Winkler and Schweitzer 2008). The combination of CTs (with fracture character) and the profile checklist sums provide an excellent tool to determine which layer is worth testing prior to a propagation saw test (PST) or ECT propagation propensity test.
- The large column snowpack tests that employ taps or jumps to apply a load to the slab (e.g., the ECT and RB) may still indicate a “no result” when a significant weak layer is buried approximately 1m or deeper—and/or when stiffer snowpack layer characteristics (e.g., a crust) reduce the likelihood that surface taps are affecting the deeper weak layer. The cautionary note is that skier triggering of a layer of this depth may still occur from shallower or weaker area (see case history below). In this scenario, one would not use the ECT or RB as the sole observation tool. It may be more prudent to identify the deeper weak layer with a CT or deep tap test (DT) and if a sudden fracture is observed choose to conduct a PST (or choose a shallower location for an ECT) to observe propensity for crack propagation in the layer. The combination of the small column test (which may err on false unstable but identifies fracture character) combined with a large column test (testing for propagation propensity) both reduces the likelihood of a missed observation and provides more information with a verified result. This “toolbox approach” may help interpret a potential “no result” or a false stable result.
The 2010 Schweizer and Jamieson article “Snowpack Tests for Assessing Snow-Slope Instability” provides an updated, excellent perspective directed at a general audience on snowpack test use and limitations. The following summary points have been paraphrased from the article:
- A good test method should predict stable and unstable scenarios equally well.
- Column tests are particularly helpful for assessing persistent slab conditions.
- Small column tests (CT and DT test) are useful for identifying weak layers and likelihood of initiation but have a tendency to overestimate instability (false unstable) conditions. Observing fracture character improves, to a degree, the interpretation of the test results. These tests are a better indicator of layer character than instability.
- Large column tests are better at predicting propensity for fracture propagation than small column tests, particularly when used in combination with other large column tests. Comparative studies suggest that the RB, ECT, and PST have comparable accuracy.
- With large column tests, repeated test results in the same location are useful but the tests repeated on similar, nearby slopes add value.
- Each test has a margin of error. Even with very experienced observers an error rate of 5-10% is to be expected. Site selection and interpretation require experience.
A TOOLBOX APPROACH TO INVESTIGATING LAYERS OF CONCERN
The Toolbox Approach in Fig. 3 may help students avoid the relatively high number of false predictions that occur due to a combination of several factors, such as extrapolation from single tests and high snowpack variability. The diagram supports a dialogue encouraging students to take a step-by-step approach and observe clues from a combination of tests and observation methods. For example, the combination of both the “yellow flags” checklist sums and fracture character in compression tests provide clues, not confirmation about whether or not a “propagation likely” scenario exists, which is then verified with a large column test that is suitable for testing within limitations posed by the particular snowpack structural properties. Understanding test limitations, matching the test to observed structural properties and verifying observations with complementary tests may improve the ability to interpret the test results and reduce false stable or false unstable predictions. I created this diagram and instructional method five years ago and have included it on the L2M3 and American professional level courses.

FIG. 3 The toolbox approach, ver. 6, Zacharias, 2015
A CAUTIONARY TALE
Backcountry winter travelers are always encouraged to make weather and snowpack observations in the field, and when possible identify on a drainage and slope scale what the public avalanche advisory describes for the region or range. For the most part, this is an effective risk management strategy. However, there have been a number of close calls, incidents and avalanche accidents with backcountry users increase their risk by not managing exposure when gathering information or misinterpreting the observations they collect. In December 2007, a fatal avalanche accident occurred on Tent Ridge in Kananaskis Country when two backcountry skiers were killed conducting a snow profile in the start zone of an avalanche path. Older examples of riders conducting tests on or very near the slope and being subsequently killed include Wawa Bowl, AB, and Mt. Neptune, BC in 1984, Thunder River, BC in 1987, and White Creek, BC in 1993. More recent incidents include Ningunsaw Pass, BC in 1999 and in Twin Lakes, CO in 2014, where a group of seven dug a profile and conducted eight CTs on a slope before choosing to ski it (see CAIC Incident Report for more information).
There are also several examples of “close calls” where test results gathered and extrapolated to chosen terrain illustrated one problem but not the primary concern. A recent example occurred in December 2013 in Hope Creek, BC involving two backcountry skiers. This is an unfortunate example where a combination of well-intentioned observations formulated a confirmation bias and decision making trap. The rider’s observations prior to descending the slope included three existing ski tracks on the slope, 15cm recent snow, light winds, -3°C and no recent avalanches. The group conducted several tests with the following results: CTM16 (SC), ECTP 23, and “numerous ski cuts in the start zone,” all revealing a significant surface hoar layer (size 7-10mm) 40cm deep but nothing deeper. A DT also revealed no results on deeper layers. The group decided that the surface hoar layer was manageable and to ski the slope one at a time. Rider 1 skied the slope with no problems and stopped 400m below, adjacent to the path trim line. Unfortunately, Rider 2 triggered the slope after landing an air low down in the start zone. The resulting D3 avalanche fractured 100m wide on basal facets 80-120cm deep and well below the surface hoar layer. The fast moving avalanche debris caught Rider 1 on the path’s edge before he could scramble to safety. Both involved were carried approximately 700m downslope. Both were buried and badly injured but were able to self extricate, call for help, and were successfully rescued
(Editor’s Note: read a first-hand account of this avalanche by Billy Neilson in The Avalanche Journal Volume 106).
Those involved generously provided the CAA occurrence report with snowpack observations and insight into what gave them confidence to venture onto this particular slope. This event is a helpful wake-up call as we can all place ourselves in their decision making shoes. In hindsight, it is revealing to examine the Kicking Horse Mountain Resort local forecaster’s public video statement issued on Vimeo on December 13, 2013 for the nearby backcountry terrain. The forecaster warned there is a “basal weakness at the bottom of the snowpack that is still reactive,” and “skier triggered size 3 avalanches have occurred,” and “avalanches had triggered larger slopes sympathetically,” and that “now is the time to be very mindful of slope history.” He went on to emphasize “without that degree of confidence that an avalanche has happened [on your slope of interest], you are really rolling the dice hopping onto big terrain.” This incident—though occurring over one week after the video statement—illustrates that when it comes to managing deeper persistent slabs, the careful observations and good well-learned techniques of the backcountry travelers were not sufficient to protect them from the lingering hazard. It also reveals the big-picture perspective of the forecaster, who clearly warned of the more serious basal concern.
Experience with this type of problem, experience monitoring unstable snow in a shallower snow climate, experience matching specific tests to specific problems, and experience managing false stable results and prioritizing the key concerns are all factors that may have given the experienced forecaster a different perspective than the backcountry riders. In this case, the knowledge of how the snowpack lay over the terrain held more weight than even a series of test results, all of which drew attention to a secondary problem that, while significant, was less so than what lurked below.
The bottom line is snowpack tests used to predict instability, while valuable when employed appropriately, are not foolproof. As Schweizer and Jamieson state obviously and importantly in the aforementioned 2010 article, “decisions about traveling in terrain should not be based solely on stability (snowpack) test results.”
REFERENCES
American Avalanche Association and USDA Forest Service National Avalanche Center. 2010. Snow, Weather and Avalanches: Observation Guidelines for Avalanche Programs in the United States. 2010. Pasoga Springs, CO: AAA. http://www.avalanche.org/research/guidelines/pdf/Introduction.pdf
Atkins, Roger. 2004. “An Avalanche Characterization Checklist for Backcountry Travel Decisions." Proceedings of the 2004 International Snow Science Workshop. Jackson Hole, WY. http://arc.lib.montana.edu/snow-science/objects/issw-2004-462-468.pdf.
Avalanche Canada Incident Report Database. Golden, Hope Creek Draining, Privateer Mountain. December 29, 2013. http://old.avalanche.ca/cac/library/incident-reportdatabase/view.
Campbell, Cam. 2008. “Testing for Initiation and Propagation Propensity.” Canadian Avalanche Association Level 2 Module 3 Lecture.
Canadian Avalanche Association. 2014. Observation Guidelines and Recording Standards for Weather, Snowpack and Avalanches. Revelstoke: CAA. www.avalancheassociation.ca/resource/resmgr/Standards_Docs/OGRS2014web.pdf
Chabot, Doug. “Another viewpoint on a Backcountry Magazine article.” Gallatin National Forest Avalanche Center Blog, November 6, 2015. http://www.mtavalanche.com/blog/another-viewpoint-backcountry-magazine-article
Colorado Avalanche Information Center. Colorado, Star Mountain. February 15, 2015. https://avalanche.state.co.us/caic/acc/acc_report.php?acc_id=526&accfm=inv
Gauthier, Dave, Cameron Ross, and Bruce Jamieson. 2008. “How To: The Propagation Saw Test.” University of Calgary Applied Snow and Avalanche Research. October 2008. http://www.ucalgary.ca/asarc/files/asarc/PstHowTo_Ross_Oct08.pdf.
Jamieson, Bruce. 2009. “Mountain Snowpack and Spatial Variability.” Canadian Avalanche Association Level 2 Module 1 Lecture.
Jamieson, Bruce. 2003. “Risk Management for the Spatial Variable Snowpack.” Avalanche News 66 (Fall 2003): 30-31.
Jamieson, Bruce and Jürg Schweizer. 2005. “Using a Checklist to Assess Manual Snow Profiles.”
Avalanche News 72 (Spring 2005): 57-61.
Jamieson, Bruce and Torsten Geldsetzer. 1996. Avalanche Accidents in Canada Volume 4: 1984-1996. Revelstoke: Canadian Avalanche Association.
Jamieson, Bruce, Jürg Schweizer, Grant Statham and Pascal Haegeli. 2010. “Which Obs for Which Avalanche Type?” Proceedings of the 2010 International Snow Science Workshop. Squaw Valley, CA. http://arc.lib.montana.edu/snowscience/objects/ISSW_O-029.pdf
Klassen, Karl. 2002. American Institute for Avalanche Research and Education Level 2 Student Manual. 2002 Version.
Ross, Cameron, and Bruce Jamieson. 2008. “Comparing Fracture Propagation Tests and Relating Test Results to Snowpack Characteristics.” Proceedings of the 2008 International Snow Science Workshop. Whistler, BC. http://arc.lib.montana.edu/snow-science/objects/P__8177.pdf.
Schweizer, Jürg and J. Bruce Jamieson. 2010. “Snowpack Tests for Assessing Snow-Slope
Instability.” Annals of Glaciology 51(54): 187-194.
Simenhois, Ron and Karl Birkeland. 2007. “An update on the Extended Column Test: New Recording Standards and Additional Data Analyses.” The Avalanche Review 26(2).
Zeleny, Milan. 1987. “‘Management Support Systems: Towards Integrated Knowledge Management.” Human Systems Management 7: 59–70.
“Skiers Died Testing for Avalanche.” The Calgary Herald, December 11, 2007. Accessed December 10, 2015. http://www.canada.com/story.html?id=75d72a3c-c743-4c65-a0c2-a18728813217.
Tags:
avalanche journal
colin zacharias
snowpack tests
Permalink
| Comments (0)
|
|