From volume 86, fall 2008
By James Floyer

INTRODUCTION
High resolution penetrometer technology has been around for a while now. The first analogue instrument was made in the 1970’s (Bradley’s resistograph) and a digital version was made a decade later (Dowd and Brown’s digital resistograph). Over the years a handful of instruments have appeared, hoping to lure practitioners into plunging probes into the snow and wean them off the laborious habit of digging pits. Although there still seems to be a lot of enthusiasm surrounding penetrometer technology, in practice the luring and the weaning just hasn’t happened yet.
While these fancy instruments have excited researchers with their ability to objectively and rapidly measure snowpack properties (most that have been produced measure hardness, some measure density), there are some good reasons why snowpack penetrometers have not found their way into everyday, mainstream snow assessment practices. One reason is cost. Personally, I don’t put too much store on this, as I firmly believe that people would be willing to pay quite a bit of money for an instrument if it made the task of assessing snowpack stability faster and/or more certain. Instead, I believe the more important reason is that we haven’t yet figured out how to reliably identify weak layers of interest (critical weak layers) from the penetrometer signals.
The study summarized here (see Floyer (2008, pp. 129-151) for a more detailed account) makes a step towards the goal of detecting critical weak layers by relating the shape of the penetrometer signal at a weak layer to the fracture character of that weak layer determined from a nearby compression test. Using the premise that weak layers that fall into the sudden fracture character category can be considered of critical interest, a scheme is presented that allows for this discrimination to be made. The scheme does require the weak layer to be pre-identified, so essentially this scheme is a method for determining the importance of a weak layer that has already been defined. At the University of Calgary, we have also been making progress towards weak layer detection, but for now, I’ll focus on the fracture character study.
METHOD
The penetrometer profiles for this study were collected using a modified SABRE penetrometer (Mackenzie and Payten, 2002) manufactured by Himachal Safety Systems. This manually driven instrument records force-resistance with depth at a frequency of 1000 Hz. The analytical techniques used here could readily be applied to data collected using other digital force-resistance penetrometers.
Compression tests were carried out in close proximity to the penetrometer profiles and the fracture character and depth of each fracture was recorded. In total, 78 penetrometer profiles and 56 compression test results were collected from 28 different site-days and 16 unique sites during the winter of 2007-2008. A typical test configuration is shown in Figure 1.
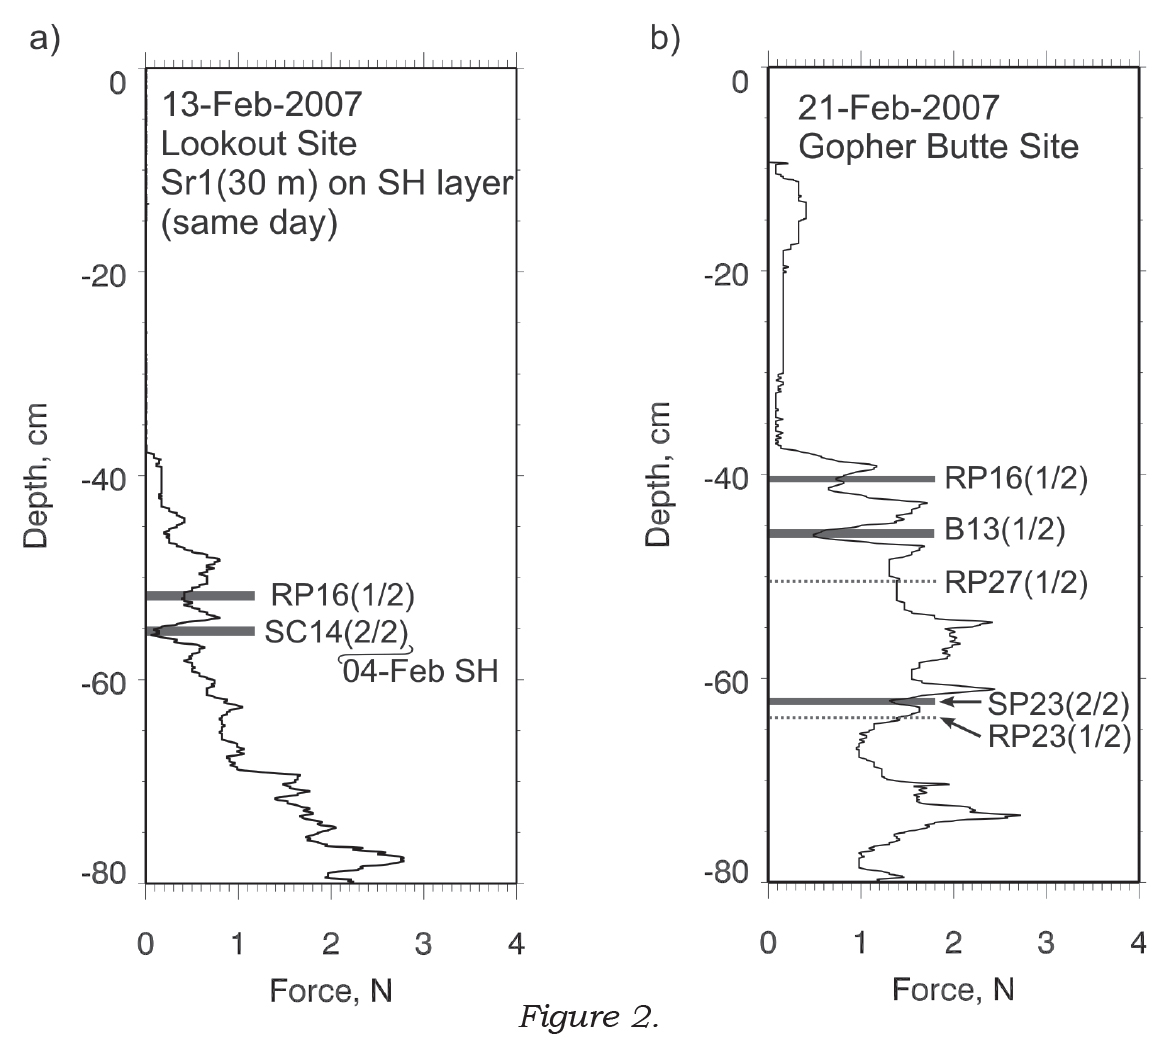
From the penetrometer profiles, weak layers (with thickness) or interfaces (with no thickness) were manually identified in the penetrometer signals using the depth information from the compression test results. Due to inaccuracies in the depth information associated with both penetrometer and compression test measurements, the weak layer/interface was interpreted in the penetrometer signal up to ±2 cm from the depth recorded in the compression test. Two examples of interpreted penetrometer pushes are shown in Figure 2. Fractures in very low resistance snow could not be identified, due to the SABRE penetrometer’s inability to measure fist resistance snow.
In total, 83 weak layers/interfaces (hereafter referred to as weak layers) were identified in the penetrometer signals. Of these, 41 were resistant planar fractures, 20 were sudden collapse, 14 were non-planar breaks, seven were sudden planar, and 1 was a progressive compression. Due to the low numbers of sudden planar and progressive compression fractures, it was decided to combine the classes into sudden fractures (sudden collapse and sudden planar) and others (resistant planar, non-planar breaks and progressive compression); this grouping reflects the higher incidence of skier-triggered avalanches associated with sudden fractures (van Herwijnen and Jamieson, 2007).
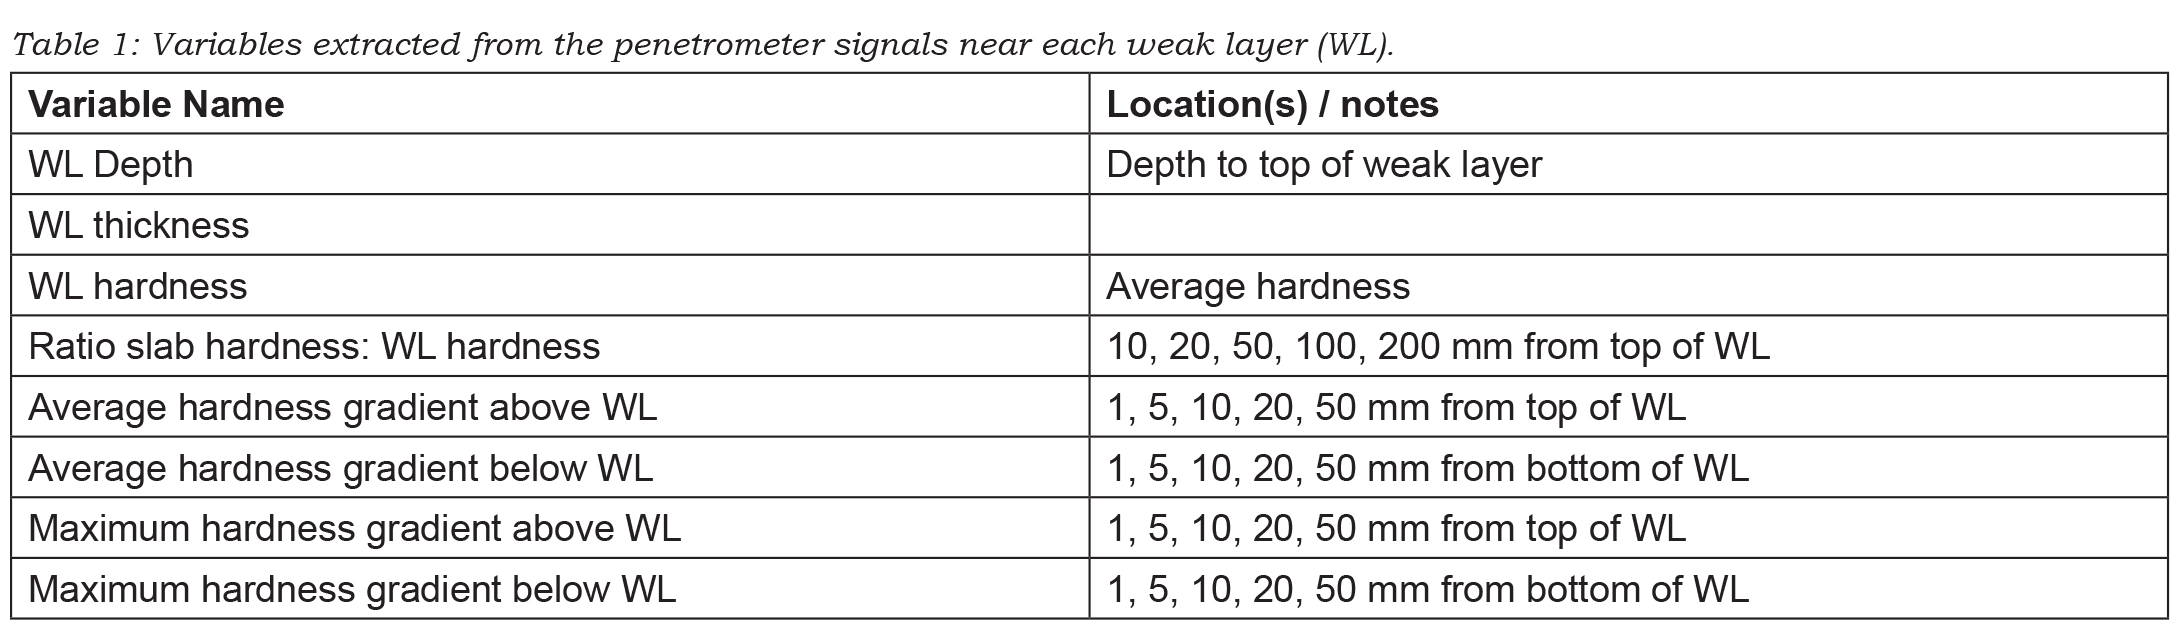
A number of variables were extracted from the penetrometer signals associated with and surrounding the interpreted weak layers. These variables are shown in Table 1. Some of the variables were tested at a number of different distances away from the top and bottom of the weak layer, since, for these variables, the optimum distance from the weak layer was unknown.
A univariate analysis was used to determine the variables that showed the greatest amount of difference in the signals associated with sudden and other groups of fractures. The best variables from the univariate analysis were selected for inclusion in a linear discriminant analysis. Discriminant analysis provides further information on the power of the variables to discriminate between the sudden and other groups, as well as giving a scheme for combining the variables and classifying the penetrometer signal into the sudden and other group.
RESULTS
The variables selected from the univariate analysis for inclusion in the discriminant analysis are shown in Table 2. The second column in this table shows the factor structure coefficients from the discriminant analysis, which gives a measure of the relative importance of each variable for discriminating between the sudden and other fracture character groups.
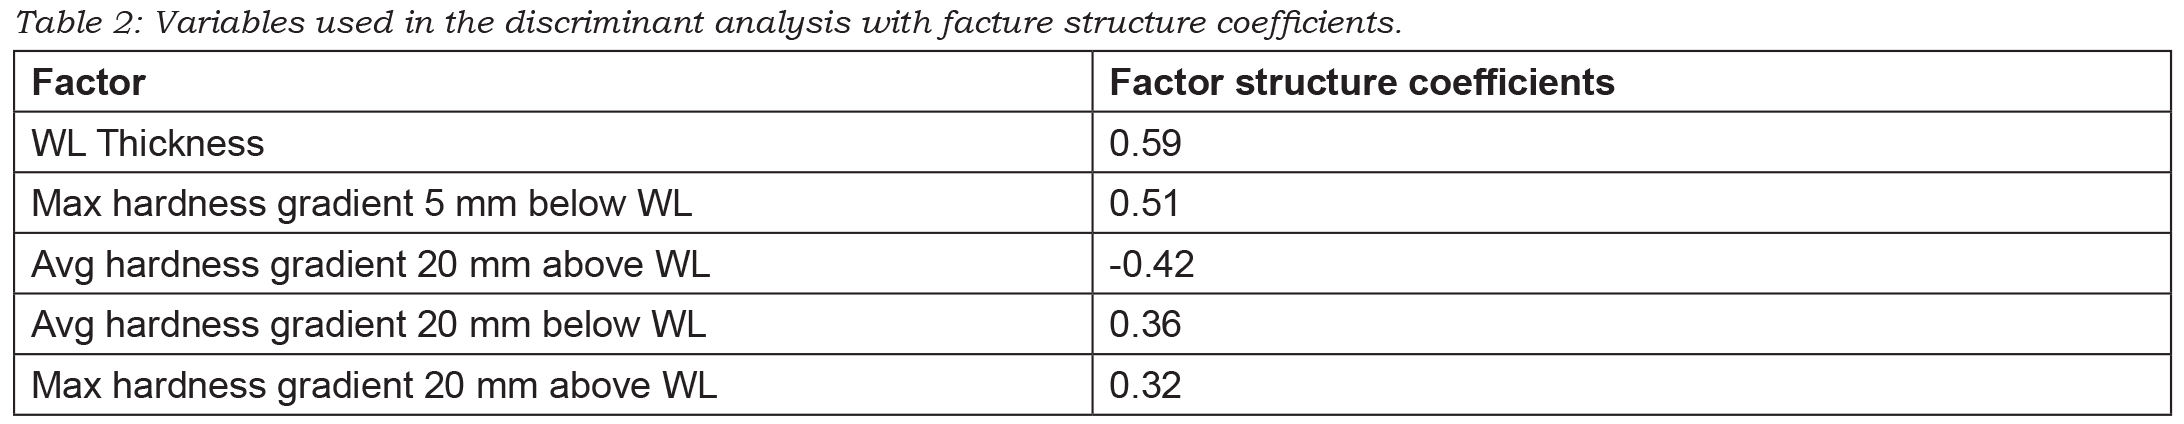
From the discriminant analysis results, weak layer thickness contributes the most to group separation, with thick layers selecting for sudden fractures. This has an intuitive explanation that thick weak layers are associated with sudden collapse fractures, which, in this analysis, account for the bulk of the sudden fractures. The variable with the second greatest contribution to group discrimination, maybe surprisingly, is the maximum hardness gradient up to 5 mm below the weak layer. For this variable, the absolute value for the maximum was used, so the positive value means that a greater maximum hardness gradient selects for sudden fractures. The average hardness gradient 20 mm below the weak layer also contributes to discrimination, although to a lesser extent. These two variables combined indicate that a stiffer substratum may favour sudden fractures.
Both the average gradient and the maximum gradient 20 mm above the weak layer also contribute to group separation, with factor loadings of -0.42 and 0.32 respectively. The negative value for the average gradient is associated with the negative average gradient values above the weak layer (generally a decrease in hardness with an increase in depth); so a higher negative value still indicates that higher values are associated with sudden fractures. These variables relate to the generally accepted view that a stiffer layer of snow above the weak layer is important for fracture propagation (van Herwijnen and Jamieson, 2007).
The discriminant function built using standardised function weights (not shown, see Floyer (2008, p. 164)) was used to classify the weak layer/interfaces identified in the penetrometer signals into sudden or other fracture character groups. Using a leave-one-out cross-validation method, 77.8% of sudden fractures were correctly classified and 81.5% of other fractures were correctly classified. The overall prediction rate was 79.6%. Classification parity was good between the two groups.
SUMMARY
A method for predicting the broad fracture character group (sudden or other) from penetrometer signals has been developed, based on a multivariate statistical analysis of penetrometer signals interpreted against fracture character results from nearby compression tests. Using a leave-one-out cross-validation method, overall classification rates of approximately 80% were achieved. Weak layer thickness, maximum hardness gradient 5 mm below the weak layer and the average hardness gradient 20 mm above the weak layer contributed the most to discriminating between the two groups.
Results for the sudden category were likely biased towards sudden collapse fractures, which dominated the data set used in this study. More observations are necessary to be able to distinguish between sudden collapse and sudden planar fractures in the sudden category, as well as between the resistant planar, progressive compression and non planar break fractures within the other category. There are also concerns over the subjective nature of the penetrometer signal interpretation, although this was mitigated by setting limits on the window in which the weak layer could be identified.
These results are promising, since they indicate that weak layers may be classified on the basis of fairly simple parameters extracted from the penetrometer signal. If combined with layer detection methods and possibly micro-structural information from higher resolution penetrometers (such as the SnowMicroPen), we move closer to the possibility of automated critical weak layer detection from penetrometer signals.
ACKNOWLEDGMENTS
I would like to thank Bruce Jamieson, who supervised my degree at the University of Calgary. I would also like to thank the entire ASARC crew, the staff at a great number of operations in BC and AB, and the various financial supporters of the ASARC program.
REFERENCES
Floyer, J. A., 2008. Layer detection and snowpack stratigraphy characterisation from digital penetrometer signals, (Ph.D. thesis), Dept. of Geoscience, University of Calgary, Calgary, Canada.
van Herwijnen, A. and B. Jamieson, 2007. Fracture character in compression tests, Cold Regions Science and Technology, 47(1-2), 60–68.
Mackenzie, R. and W. Payten, 2002. A portable, variable-speed, penetrometer for snow pit evaluation, Proceedings of the International Snow Science Workshop (2002: Penticton, BC), 294–300.


