  
|
Posted By Administration,
March 17, 2021
|
From volume 108, winter 2014-15 By Mike Koppang WORRY WHENEVER I GET AN EMAIL from Karilyn at the CAA—I figure I have either once again forgotten to pay my dues, dated a cheque wrong, or done something else to create undue work for association staff in Revelstoke. Thankfully, this time it was simply a request to write about last winter’s busy rescue season out here on the east side of the divide. The 2013-14 season was busy with responses but one event sticks out in my mind, especially in the early season.
The incident occurred in a popular early season ice climbing area known as Ranger Creek, in the Smith Dorrien region of Kananaskis. The climbs in this area see lots of early season ice climbing traffic, in part due to their short, 45-minute approach and short drive from the Calgary/Canmore area. These climbs also, unfortunately, have a long history of catching parties off guard regarding avalanche hazard, and have been the scene of a few burials and accidents. Thankfully, we have had no fatalities in this area related to avalanche accidents, but despite all the public messaging this area still seems to produce an involvement every few years. 
PHOTO FROM KANANASKIS COUNTRY PUBLIC SAFETY
The accident occurred in the late morning of November 2, 2013. It was during our first major storm of the season, with relatively small prior snowfalls. The request for assistance came in via a Personal Locator Beacon, which is similar to a SPOT device but transmits its signal to a different call centre coordinated by the Department of National Defence in Trenton. Through the registration details of the device, we were able to determine that it was owned by a European group who were climbing and skiing in the Rockies, and the latitude/longitude of the emergency transmission put it somewhat close to the climbing area up Ranger creek.
Conservation officers who work within the Kananaskis Country Public Safety program responded to the area to look for cars and perhaps talk to people near the trailhead to gather some information and initiate a response. Public Safety Specialists Jeremy Mackenzie and I were unable to fly with Alpine Helicopters from Canmore due to heavy snowfall and limited visibility, and had to respond by ground. Conservation officers on site reported localized weather of S4 with moderate SW winds and 20cm of accumulation on the road since earlier that morning.
As conservation officers reached the trailhead, they observed one person walking out of the area who reported an avalanche above the routes known as Chalice and the Blade and Lone Ranger. These are two 60m grade 4 and 4+ routes located at the head of the valley in complex terrain. The reporting party informed the officer that two separate groups of three people had been walking up to the base of the two routes. As they walked toward the routes, they were discussing the avalanche danger and commenting on changing conditions in the valley due to the associated heavy snowfall. As both parties arrived at the base a few minutes later, they discussed the avalanche danger. As this discussion took place, all six people were struck by an avalanche from the overhead slope. None had any avalanche safety equipment.
Most members of the two separate parties had already put their helmets on during the discussion about the increasing avalanche danger. As a result, their backpacks were off when the avalanche occurred, and what gear they had was scattered across the slope. The slide was 40m wide and ran for 250m. We were unable to get a fracture depth or failure plane, but suspected it to be the October rain crust located just above the ground.
Of the six people hit, two remained on the surface, two were partial burials with their heads above the surface, and two were buried face down. The first person buried face down was able to self-extricate and clear their own airway, but the second was located 100m downslope with only part of a boot sticking out. This person was dug out using hands, helmets and a few ice tools that the two parties still had with them. The victim was unresponsive and the group initiated artificial respirations/CPR and pressed the emergency notification on their personal locator beacon. The victim recovered a few minutes later and amazingly was able to walk out on their own a short while later. No one in the group suffered any major injuries.
I spoke to one of the members of the group back at the trailhead later that morning. They told me that when they first left the parking lot, the terrain around them and the route was mainly gravel or bare rock with some patches of snow. They recognized as they headed up towards the route that the avalanche danger was increasing, but failed to recognize just how quickly it was changing. The contributing factors in the accident were likely this failure to adapt to the new information as it came in combined, with high levels of motivation for that first day out climbing.
Another interesting point is that all people involved were wearing their helmets during the slide, and a few of those helmets suffered damage during the event from striking rocks and other debris. Helmets perhaps minimized the extent of injuries suffered.
During follow-up conversations with two parties, they recognized that were pretty fortunate to sustain only minor bumps and bruises for injuries. They lost lots of gear on the slope, and learned lessons from the near miss. While I did not ask if they would carry avalanche gear on their next outing, I kind of assumed it. One person decided abstinence from ice climbing was an even better approach, which made me chuckle.
Using companion rescue gear while ice climbing is becoming more of a norm these days, as it is advocated by the Association of Canadian Mountain Guides and different guiding companies. If all six people involved had avalanche safety gear at the time of the avalanche, the outcome would not have been that different, as everyone was visible from the surface—luckily. However, having a shovel or shovels would have made the rescue faster and more efficient. Having said that, if the debris had buried the exposed boot just a few centimetres deeper under the surface, there is a good chance that this accident may have resulted in a fatality.
There are lots of good options for lightweight shovels and probes that can be taken ice climbing these days. For me, when the skiing get so bad that I have to go ice climbing, my gear will be with me in my pack.
Tags:
ice climbing
mike koppang
Permalink
| Comments (0)
|
|
|
Posted By Administration,
February 10, 2021
|
From volume 119, winter 2018-19 By Laura Maguire and Jesse Percival COGNITIVE SYSTEMS ENGINEERING (CSE) demonstrates how expert practitioners in high risk/high consequence domains make sense of risk in dynamic, ambiguous and changing conditions. Expert performance is identified as going beyond qualifications to include the ability to activate, organize and flexibly apply knowledge (Woods et al, 2010) in time pressured, goal conflicted and uncertain conditions. To do so involves cognitive work.
Using methods from CSE, this study assessed the operational aspects of snow safety then analyzed the artifacts (tools such as worksheets, websites, whiteboards, InfoEx, etc.) that shape cognition and collaboration. Semi-structured interviews were used to detail how tools are used to make and update forecasts over time. Finally, we elicited examples of surprise, near misses and actual incidents to calibrate findings.
Three prominent, interconnected themes emerged from the research:
- Much of the cognitive work is not described in the explicit protocols. The formal representations of what constitutes good practice in forecasting is a small fraction of the strategies experts use.
- The cognitive effort required to manage avalanche risk is a near continuous activity. Forecasting appears to require ongoing calibration. Disruptions to this calibration process have adverse effects on performance.
- Forecasting is a distributed cognitive task across individuals, teams and the broader industry. Successful forecasting requires distributed practitioners of local team members as well as the resources and insights produced by others within the industry.

MT. WASHINGTON FORECAST TEAM EXAMINING THE SNOWPACK AND MENTORING NEW MEMBER // JESSE PERCIVAL PREPARATIONS FOR FORECASTING
Formally, the protocols for a forecaster on duty (FOD) suggests producing a control plan shortly after arriving onsite - but each forecaster interviewed detailed extensive preparations that were not captured by the formal description. A variety of work-related techniques were described. For example, time spent carpooling is used as an informal handoff from one FOD to another to discuss recent activity or control measures. This suggests that formulating the day’s forecast begins well in advance so that a forecaster arrives for duty with a hypothesis of how recent changes in conditions affect their avalanche terrain management.
Shared, off the books activity is a common (and likely necessary) practice not explicitly noted in work procedures and demonstrates a need for ongoing calibration – an example that supports all three findings. It is well documented that forecasting takes place under time pressure. By seeking out data that can help them anticipate conditions in advance, the FOD relieves some of this pressure to lessen the cognitive demands required once they officially clock in.
DISRUPTION, ADAPTATION & SURPRISE
A second example: An unexpected in-bounds release. On this day, the forecasting plan had anticipated instabilities due to temperature changes. After control work, it was expected that normal monitoring would identify if a closure was necessary. However, a personal emergency meant the team was operating one person short. Concurrently, a first aid emergency tied up members who would otherwise be monitoring avalanche terrain. This left the FOD ‘in the bump’ for longer than the usual rotation and his normal practice was interrupted. As expected, the temperature fluctuated and a skier-triggered release occurred in one of the avalanche zones.
This example is informative in two ways. Firstly, it is reflective of what “normal work” is – constantly adjusting to workload demands or unavailability of resources and adapting practices to respond to conditions while balancing inevitable tradeoffs. Secondly, this example provides evidence that practitioners construct mental models (Adams, 2005) and continually update them. 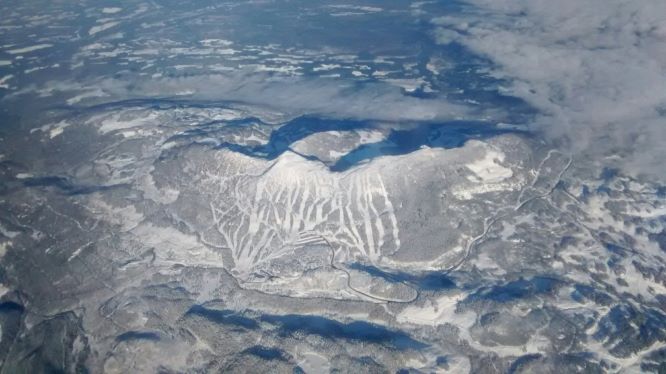
THE BIG PICTURE - MOUNT WASHINGTON // COLE RAMSHAW
MENTAL MODELS
The model is an internal representation of current hazards and an expectation of how this may change over time. Mental models are used to retrieve technical knowledge and to flexibly apply it to variable situations.
In constantly changing conditions, mental models become stale unless continually updated. Referring to the in-bounds avalanche example, the model became insufficient after only a few hours. In the previous example, the forecaster coming back from time off is aware their model is stale and seeks information to recalibrate. LaChapelle (1980) notes a “...prevalent and strong reluctance of working forecasters to experience an interruption in their winter routine…” (pg. 78). This finding emphasizes organizing work schedules to protect forecasters’ daily and seasonal monitoring routine from interruptions or building in mechanisms to support rapid recalibration or redundancy by cross-checking across other team members.
DISTRIBUTED COGNITIVE EFFORTS
Notable as well, is the role of a distributed network in constructing mental models. A diverse range of perspectives informed by different experiences, knowledge and mindsets is needed for accuracy. In the resort, the schedule for FOD’s is designed to provide an overlap day to accommodate the need for distributed cognition. This is an explicit recognition of both ensuring currency of the mental model and the importance of interactions between practitioners. Updating provides an opportunity to draw attention to details and to generate shared insights.
Spatial and temporal constraints also require distributed cognitive efforts. Large terrain and limited daylight hours create time pressures. The FOD relies on technicians to gather and relay data efficiently and accurately. Without the team, the FOD’s mental model can only partially represent actual conditions.

WITH UNCOMMON SNOWPACKS BECOMING INCREASINGLY COMMON, PRACTITIONERS IN A COASTAL SNOWPACK HAVE BEGUN DEPLOYING NEW STRATEGIES // JESSE PERCIVAL
CONCLUSIONS
Errors by normally high performing experts are insights into how the cognitive demands may become temporarily overwhelming. Studies like this illustrate what aspects of practice should be protected from the pressures of ‘faster, better, cheaper’ common in many workplaces and allows for better engineering of the tools, technologies and protocols used.
Further research can provide an empirical basis for: designing decision support tools; developing training; orchestration & distribution of tasks; funding critical resources; and developing new forms of coordination across networks. Identifying cognitive work in different forecasting settings (mechanized skiing, transportation, industrial) is likely to be useful for accident prevention. In addition, CSE studies comparing expert vs recreational cognition is likely to help public safety efforts.
The authors gratefully acknowledge the Avalanche Canada Foundation for their travel support through the ISSW Fund and the Cora Shea Memorial Fund. For the complete proceedings paper or more information about this and other projects in cognitive work of avalanche forecasting contact Laura (maguire.81@osu.edu) or Jesse (jperceival@mountwashington.ca)
REFERENCES:
Adams, L. (2005). A systems approach to human factors and expert decision-making within Canadian Avalanche Phenomena. MALT Thesis. Royal Roads University,
Victoria, BC, 284.
LaChapelle, E. R. (1980). The fundamental processes in conventional avalanche forecasting. Journal Glaciology, 26(94), 75–84.
Woods, D., Dekker, S., Cook, R., Johannesen, L., Sarter, N. (2010). Behind Human Error. London: CRC Press.
Tags:
avalanche journal
cognitive systems
laura maguire
Permalink
| Comments (0)
|
|
|
Posted By Administration,
February 3, 2021
|
From volume 74, Fall 2005 By Cam Campbell
Many British Columbians believe that the El Niño-Southern Oscillation index (ENSO) provides a hint of the winter to come. If the index is in a strong El Niño (warm phase), BC’ers gear up for a fat snowpack season. We all remember the winter of 1999: strong El Niño and record snowfall in southwestern BC (Figure 1). This study looks at the validity of using the ENSO and other climatic indices to predict the winter to come. For this study, winter (February 1st) and spring (April 1st) water equivalent of the snowpack (SWE) for seven regions in BC were correlated with four different climatic indices: ENSO, Pacific North American (PNA), Pacific Decadal Oscillation (PDO) and North Pacific (NP).
Motivation for this article came from meteorologist David Jones’ presentation at the 2004 Backcountry Avalanche Workshop on using ENSO as a predictor for West Coast snowfall. In his presentation, David showed that above-average snowfall on the West Coast is sometimes associated with a strong ENSO (warm or cold) but overall the correlation is relatively weak. Several other studies have focused on the relationships between snowpack and hydrologic variability and climatic fluctuations, especially in the Western United States (e.g. Yarnal and Diaz 1986; Cayan and Peterson, 1989; Koch et al., 1991; Redmond and Koch, 1991; Cayan and Webb, 1992; Chagnon et al., 1993; Dracup and Kahya, 1994; McCabe, 1994; Sittel, 1994; Ropelewski and Halpert 1996; Mason and Goddard 2001; Smith and O’Brien 2001; Patten et al., 2003; and the list goes on) but few in Canada (e.g. Moore and McKendry, 1996; Moore and Demuth, 2001). 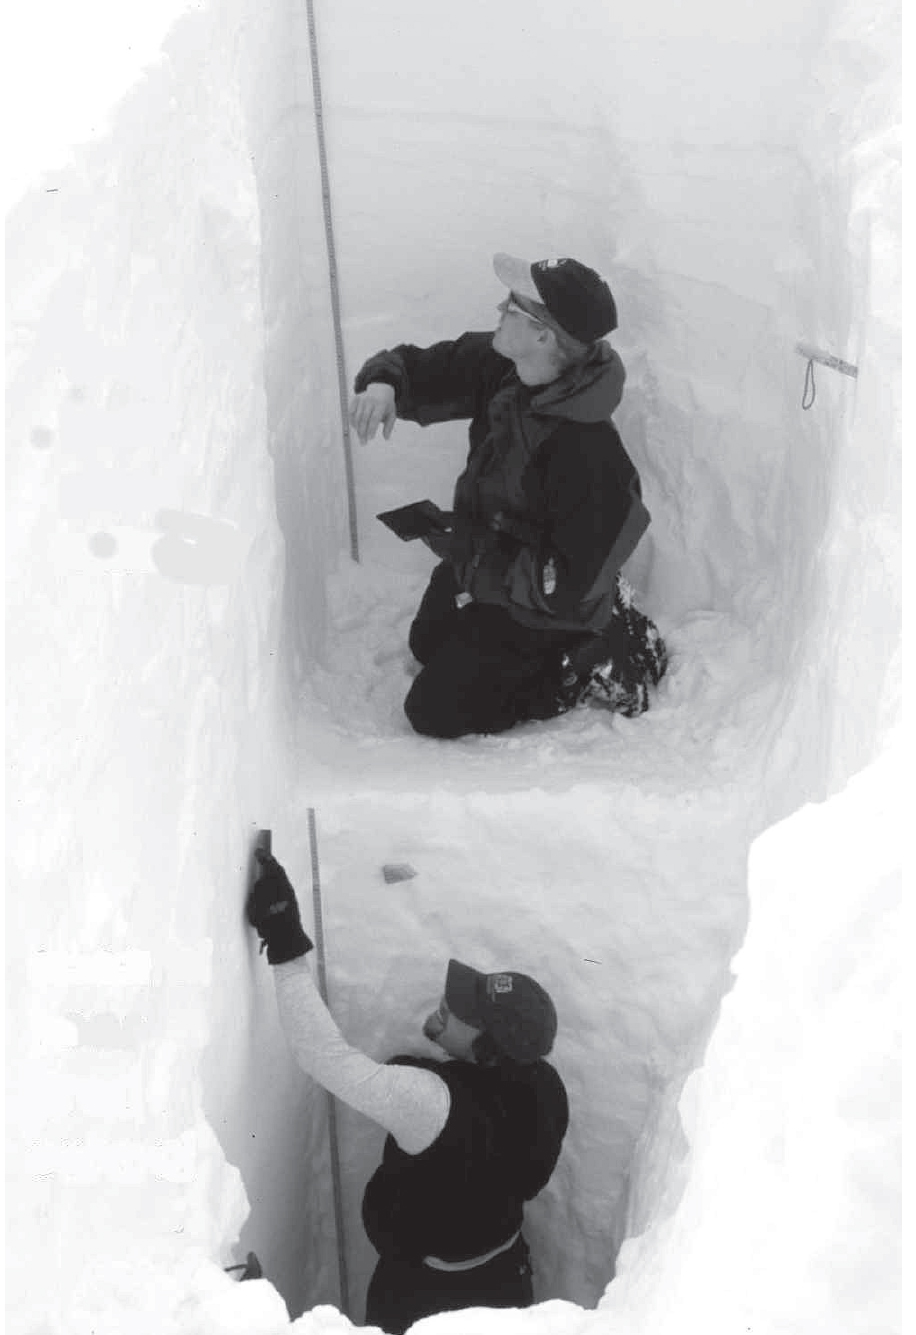
Figure 1 – Full-depth profile at Fidelity Mtn. in the Columbia Mtns. during the winter of 1999 (Applied Snow and Avalanche Research, University of Calgary (ASARC) photo).
El Niño-Southern Oscillation (ENSO)
The ENSO index is calculated from the standardized pressure difference between Tahiti and Darwin, a small fishing village on the Chilean coast, and represents the effects of an El Niño event on the strength of the equatorial easterlies (Moore and Demuth, 2001). The occurrence of blocking in the Bering Strait is sensitive to the phase of the ENSO cycle and the frequency of blocking is most strongly influenced by the ENSO in January and February (Renwick and Wallace, 1996).
“Blocking” refers to the breakdown of the prevailing mid-latitude westerly flow in the troposphere which produces persistent ridging over the northeast boundary of the Pacific, effectively blocking fronts associated with cyclonic activity over the Aleutian Islands from reaching BC. Sixty-nine percent more days of blocking occurred during the cold phase of the ENSO cycle than during the warm phase, and the frequency of blocking days is 40% lower during the warm phase of the ENSO compared to other winters (Renwick and Wallace, 1996).
North Pacific (NP)
Trenberth and Hurrell’s (1994) NP index represents the intensity of the Aleutian Low in winter and is the anomaly of the areaweighted mean sea level pressure to the mean between 1925 and 1988 for a given area over the North Pacific. Air temperature has been negatively correlated with the North Pacific (NP) index. That is, warm winters are associated with low NP values, whereas precipitation shows a weak positive correlation with NP (Moore and McKendry, 1996).
Pacific Decadal Oscillation (PDO)
As the name suggests, the PDO index is based on oscillations that occur somewhere in the Pacific Ocean every 10 years or so. In fact, it is the time series scores associated with the leading principle component of sea surface temperature in the Pacific Ocean, north of 20°N (Zhang et al., 1997). A positive PDO (warm phase) represents warmer than average water in the equatorial Pacific and colder than average water in the North Pacific, vice-versa for a negative (cold phase) PDO. Moore and Demuth (2001) found that snow accumulation tends to be greater during PDO cold phase winters, which explains lower observed winter accumulation after 1976 when PDO shifted from its cold phase to the present warm phase.
Pacific North American (PNA)
At 55 years old, the PNA index is the youngest used in this study. The PNA index is a mode of winter atmospheric circulation which is naturally and internally generated (Wallace and Gutzler, 1981). Positive values of the PNA (enhanced phase) represent an enhanced Rossby Wave over Western North America with southerly to southwesterly flow over the West Coast which results in warm advection into the southern Coast Mountains (Moore and Demuth, 2001). Moore and McKendry (1996) found that BC winters dominated by enhanced PNA produced overall shallower than average spring snowpack. Intensification of the PNA
index is associated with southwesterly flow over the eastern north Pacific which is likely to cause increased freezing levels and less precipitation, and result in less snow accumulation (Moore and McKendry, 1996).
Methods
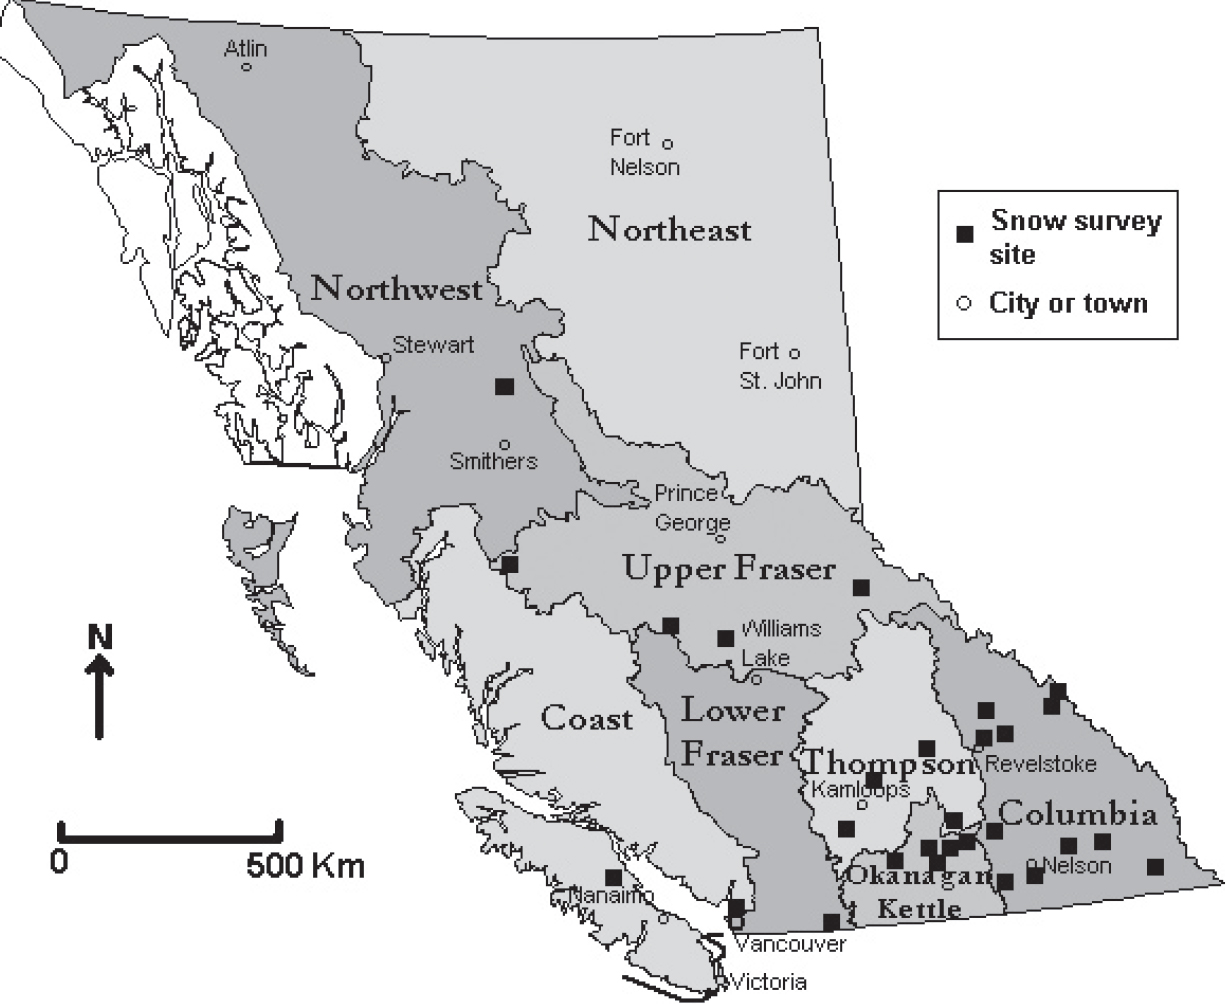
Figure 2 – Map of British Columbia showing the eight regions: Northwest, Northeast, Coast, Upper Fraser, Lower Fraser, Thompson, Okanagan-Kettle and Columbia. The snow survey sites used in this study and landmark cities or towns are also marked (Source: British Columbia Ministry of Water, Land and Air Protection) The BC Ministry of Water, Land and Air Protection (MWLAP) divided the province into eight regions based largely on major drainages. Figure 2 shows the eight regions and the snow survey sites used in this study. The first thing you’ll notice is a lack of sites in the northern half of BC In fact, no sites were used in the Northeast region due to insufficient data so you can disregard the Northeast. The southern regions, on the other hand, have sites with historical data dating back to the mid-1930s. For the sake of statistical significance an emphasis has been placed on the southern half of the province.
Yearly SWE data collected on, or within a few days of, February 1st and April 1st were obtained from the MWLAP’s River Forecast Centre website. The regional average SWE was determined by averaging the SWEs from all snow survey sites used in that particular region. For the case of the Columbia region this means 11 sites (Figure 2), whereas due to insufficient data only one site was used to represent the Lower Fraser and Northwest regions. In order to maintain spatial bias, the average of all regional average SWEs was used to represent the provincial average.
Table 1 lists the websites from which climatic index data were obtained. Most people would agree that the snow usually starts accumulating in the BC mountains sometime in November. For this reason SWE data on February 1st were correlated with the average index values for the previous three months (November, December and January) and SWE data on April 1st were correlated with the average index values for the previous November to March. In doing this, the total amount of snow on the ground is only compared to the index values of the months during which it accumulated.
Table 1 – Websites used to obtain climatic index data 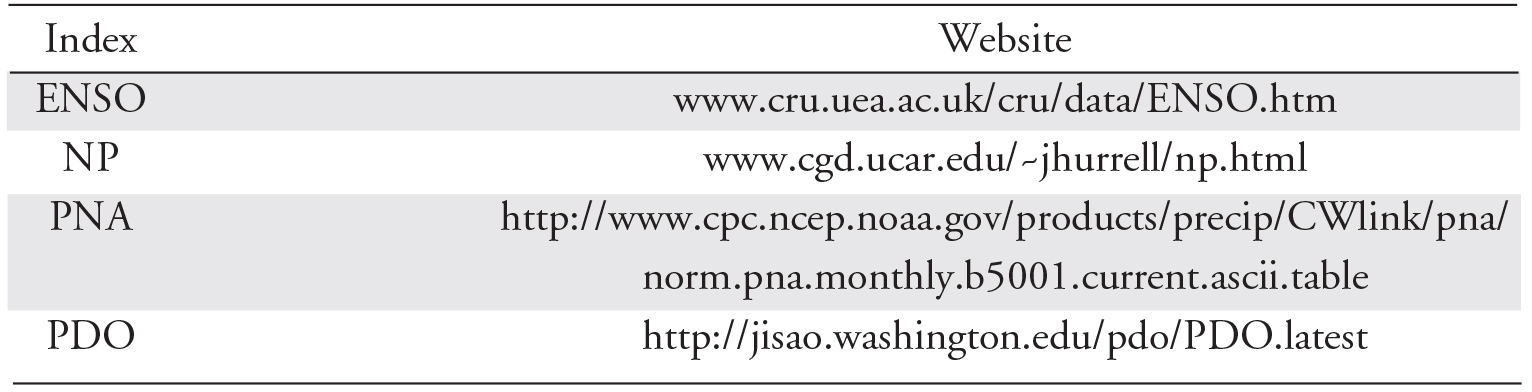
Since all the data were normally distributed, Pearson linear correlation analysis was used to describe the associations between SWE and the climatic indices. Pearson’s R statistic describes the strength of the correlation, with a perfect linear correlation represented by R = 1. The p-value is a function of R and the sample size (N) that quantifies the confidence in the correlation. In this case N corresponds to the number of years in which data were available. Multivariate least-squares linear regression was used to describe the influences that two or more variables may have on a single variable. Multivariate regression analysis produces a Coefficient of Multiple Determination (R2), which is essentially an R statistic for linear associations in more than two dimensions. In order to directly compare the results from the two analysis techniques, Pearson’s R statistic was squared. In accordance with most scientific studies, all correlation and regression coefficients were considered statistically significant at the p < 0.05 level. This means that there is a 5% chance of a Type II error where a coefficient is considered to be statistically significant when in fact it is not.
Results
Provincial
Figure 3 shows time series plots of yearly average PDO, PNA, NP and ENSO indices and provincially averaged SWE for both February 1st and April 1st from 1935 to 2004 (except PNA which doesn’t start until 1950). Consider the three-year period from 1940 to 1942. These winters were characterized by some of the lowest SWE on record and a period of strong La Niña, strong negative NP and strong positive PDO conditions. Now consider the winter of 1999. As
mentioned before, this winter was characterized by high SWE across the province which coincides with strong El Niño, strong negative PDO and relatively weak positive PNA and NP conditions. Interpretation of the remainder of Figure 3 will be left up to the reader.
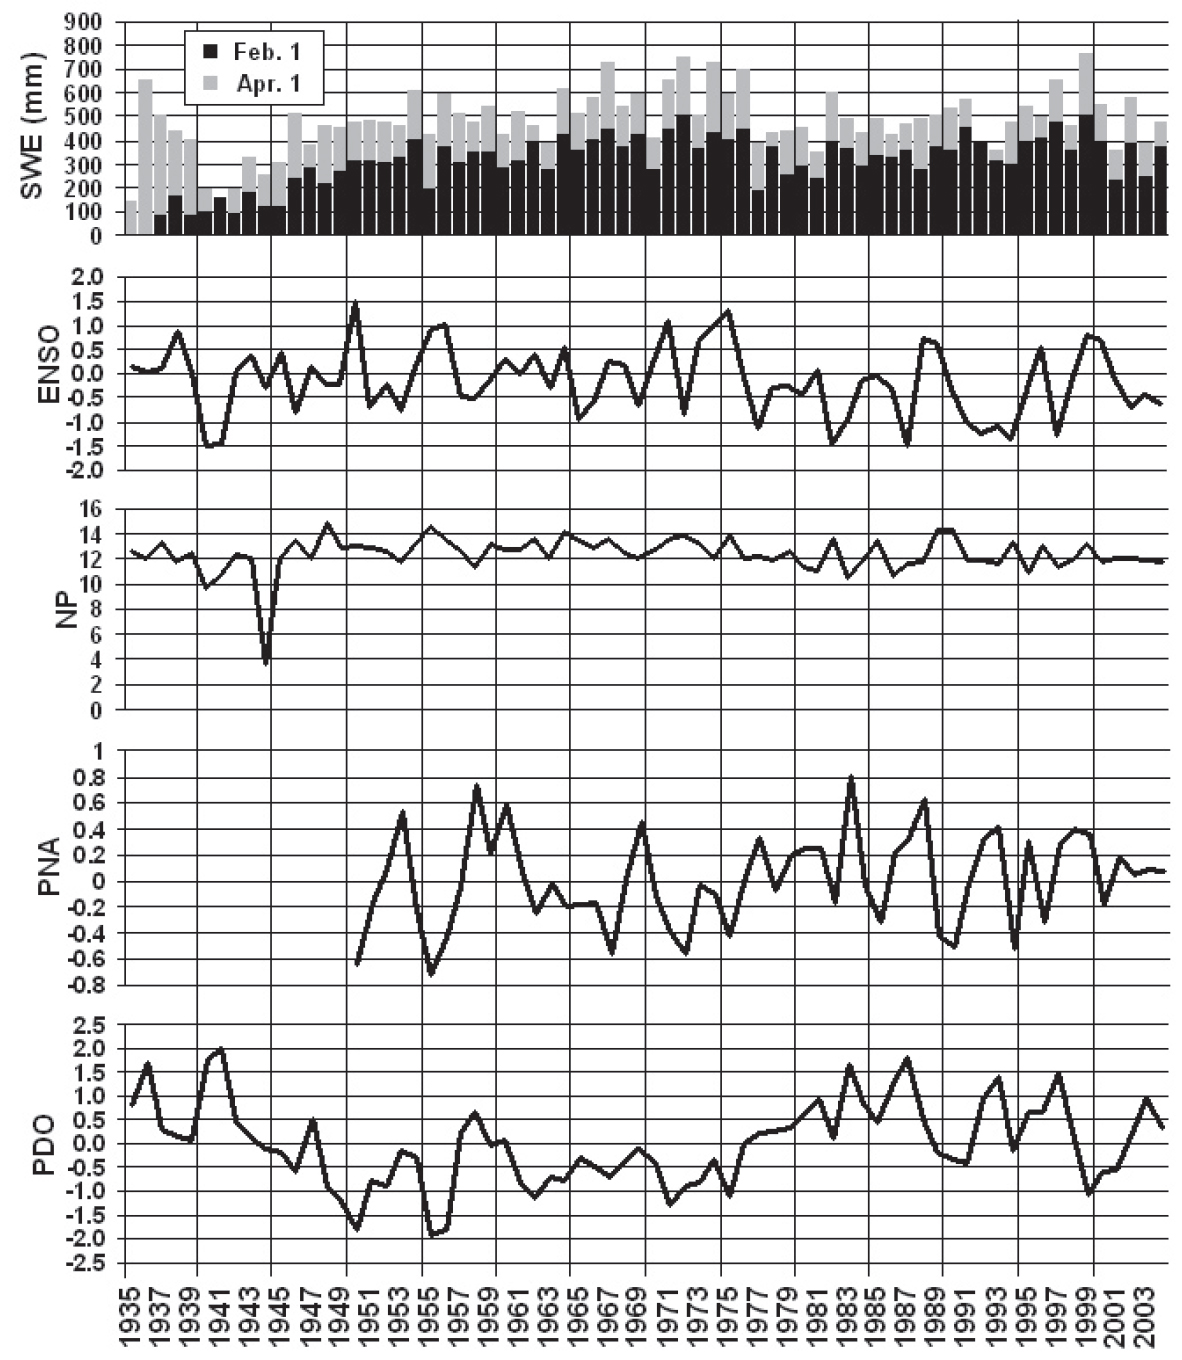
Figure 3 – Time series of the yearly averages of monthly Pacific Decadal Oscillation (PDO), Pacific North American (PNA), North Pacific (NP) and El Niño-Southern Oscillation (ENSO) index data from 1935 to 2004. Also shown is the provincially averaged Snow Water Equivalent (SWE) for both February 1st and April 1st from 1935 to 2004 (except PNA which doesn’t start until 1950). There is no February 1st SWE data for 1935 and 1936.
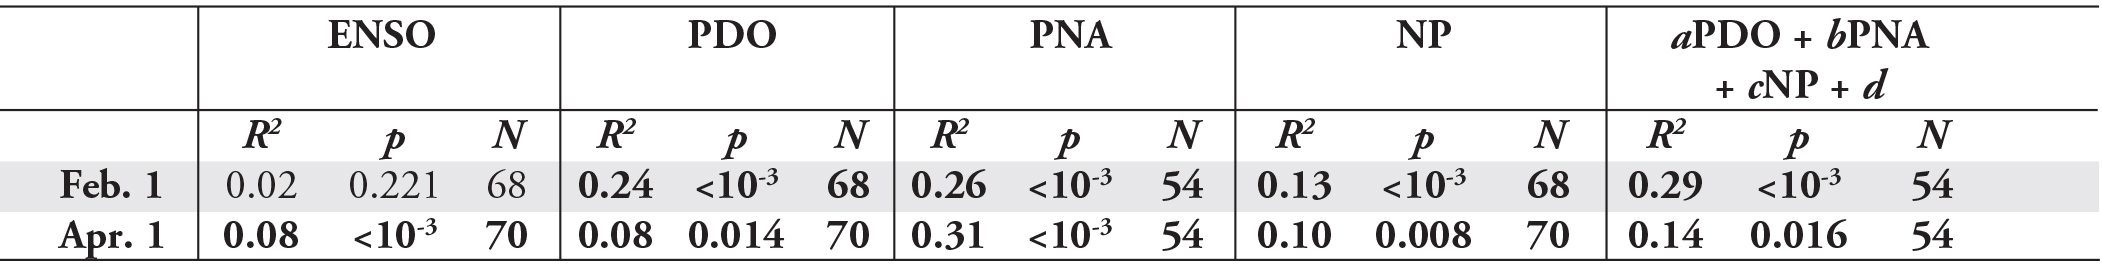
At first glance, it would appear that ENSO’s performance is lacking compared to the other indices (Table 2). The correlation with February 1st SWE wasn’t significant and although significant, the correlation with April 1st SWE was weak compared to the other indices. PNA was the best performer, in terms of predictive merit, for both April 1st and February 1st provincial SWE. It is also interesting to note that the correlations with ENSO and NP are positive (i.e. a strong El Niño or NP index corresponds to a high SWE) whereas the correlations with the other indices are negative. Of course, this cannot be seen in Table 2 as all the correlation coefficients have been squared.
Multivariate least-squares linear regression was used to assess the predictive merit of the top three performing indices combined. In this case, PDO, PNA and NP were used according to the following equation:
SWE = aPDO + bPNA + cNP + d (1) When the three indices are combined, the R2 for February 1st SWE was greater than for any individual index, suggesting that more variability can be explained by combining of PDO, PNA and NP. This, however, is not the case for April 1st SWE, where PNA outperforms the combined indices.
Table 2 – Squared Pearson linear correlation coefficients (R2) for the correlations between February 1st and April 1st provincially averaged SWE and each of the four climatic indices. The coefficient of multiple determination (R2) for the equation: SWE = aPDO + bPNA + cNP + d is also given. All coefficients which have a p < 0.05 are marked in bold.
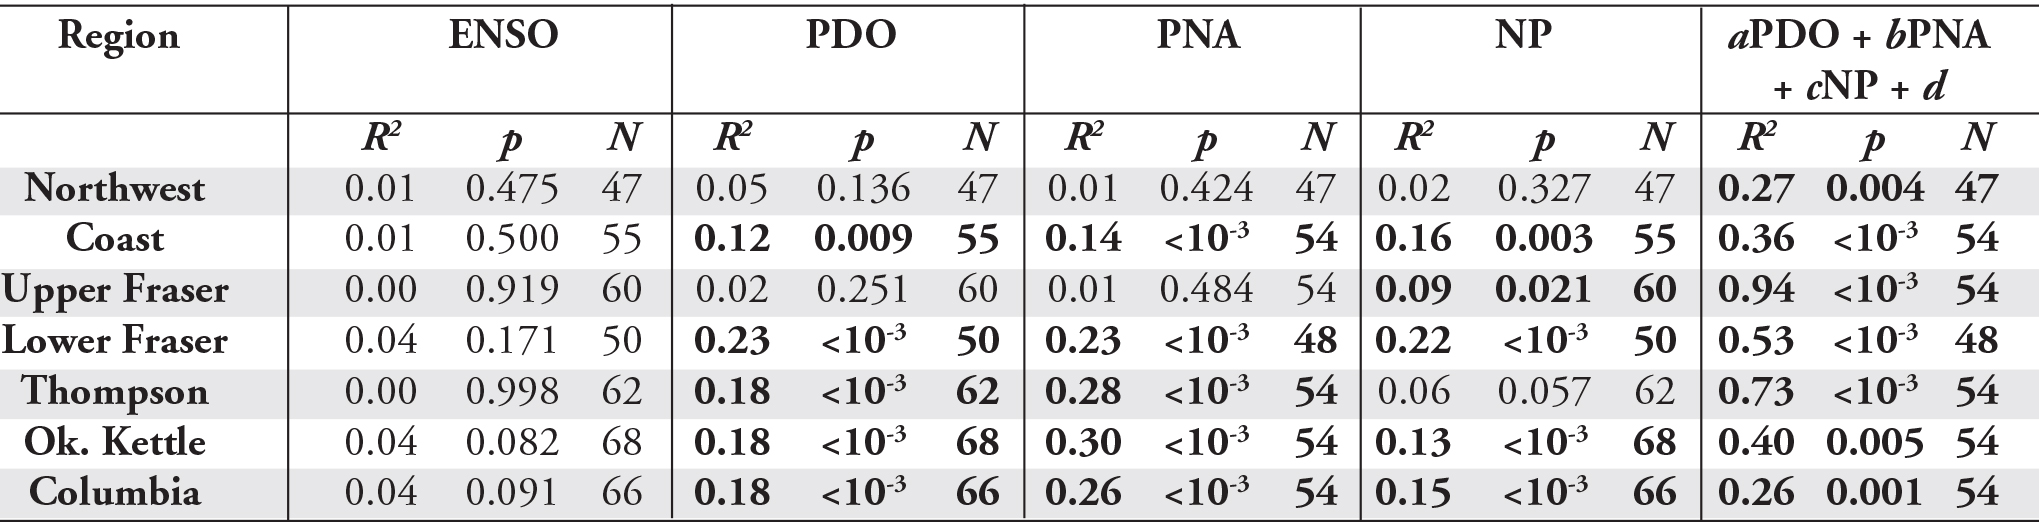
Regional
Once again PDO, PNA and NP in Table 3 seemed to outperform ENSO with more statistically significant correlations and higher overall correlation coefficients. In fact, none of the regions had significant correlations between ENSO and February 1st SWE. All correlations with ENSO and NP are again positive, while all correlations with PDO and PNA are negative. All regions, except the Northwest, had significant correlations between at least one index and February 1st SWE. Once again, PNA seemed to be the best performing index for February 1st SWE, especially for the Thompson, Okanagan-Kettle and Columbia regions. Multivariate least-squares linear regression was again used to assess the combined predictive merit of the PDO, PNA and NP indices based on Equation 1. By combining the three indices, the ability to predict February 1st SWE for all regions, except the Columbia region, was improved. In fact, for the Upper Fraser region the three indices were able to account for 94% of the variability in February 1st SWE.
Table 3 – Squared Pearson linear correlation coefficients (R2) for the correlations between February 1st regionally averaged SWE and each of the four climatic indices. The coefficient of multiple determination (R2) for the equation: SWE = aPDO + bPNA + cNP + d is also given. All coefficients which have a p < 0.05 are marked in bold.
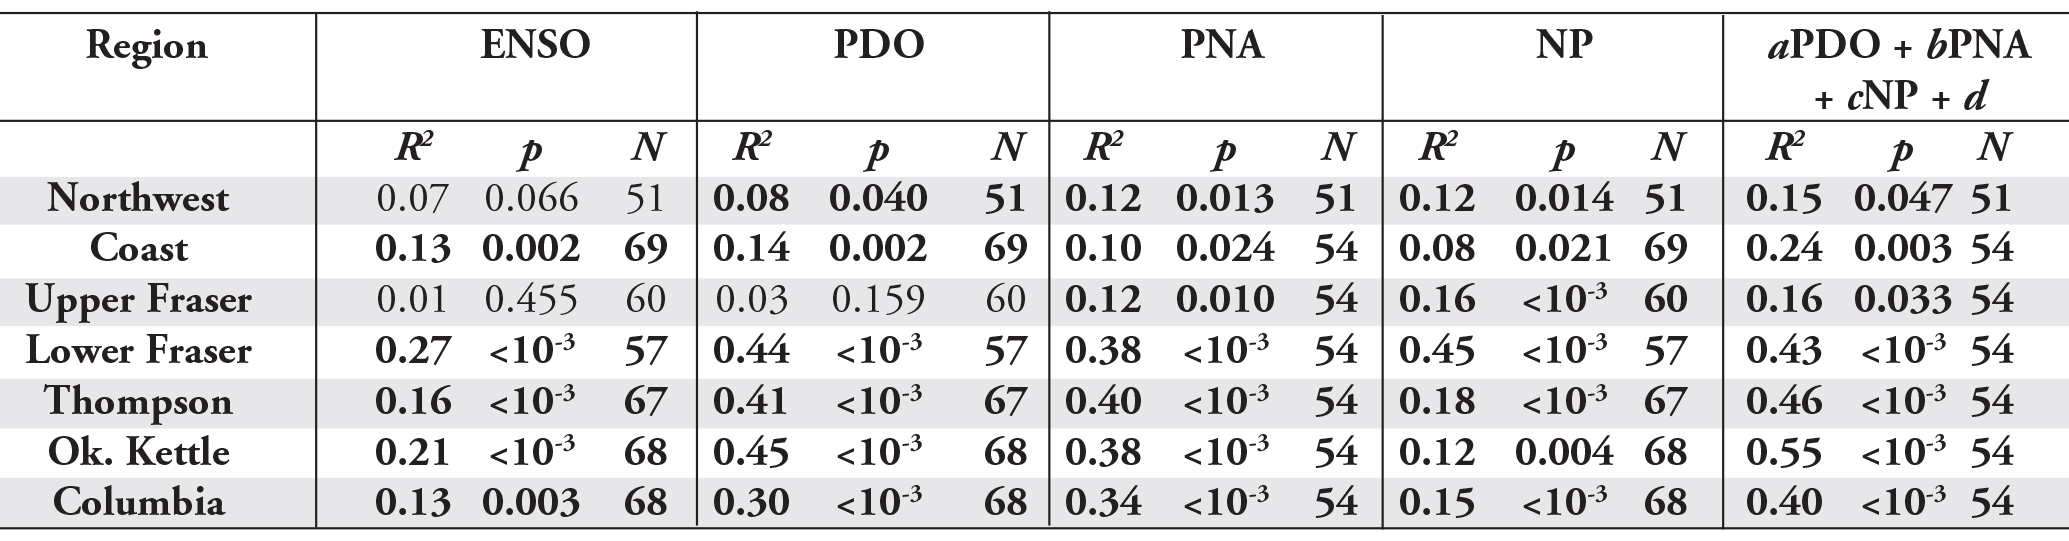
The first thing you’ll notice is an increased number of significant correlations and overall stronger correlations for April 1st SWE (Table 4) than for February 1st SWE (Table 3). Again, PDO, PNA and NP outperformed ENSO in terms of predictive merit. These three indices were, again, combined for regression analysis. By combining these three indices the amount of variability explained by the linear trends was improved for all regions except the Upper and Lower Fraser regions where NP did a better job alone.
Table 4 – Squared Pearson linear correlation coefficients (R2) for the correlations between April 1st regionally averaged SWE and each of the four climatic indices. The coefficient of multiple determination (R2) for the equation: SWE = aPDO + bPNA + cNP + d is also given. All coefficients which have a p < 0.05 are marked in bold.
Top Five Sites
The top five performing snow survey sites, in no particular order, are: McBride in the Upper Fraser region; Blue River in the Thompson region; Fidelity Mountain in the Columbia region, Sullivan Mine in the Columbia region; and Fernie East in the Columbia region (Tables 5 and 6). ENSO has once again dropped the ball, PDO, PNA and NP, however, look promising (Tables 5 and 6). Again, the correlations with April 1st SWE were stronger than those with February 1st SWE for all sites and all correlations with ENSO and NP are positive, while PDO and PNA consistently show negative relationships with SWE. Once again, a combination of PDO, PNA and NP did a better job of predicting February 1st (Table 5) and April 1st (Table 6) SWE than any of
the indices alone.
Table 5 – Squared Pearson linear correlation coefficients (R2) for the correlations between February 1st SWE for the top five performing snow survey sites and each of the four climatic indices. The coefficient of multiple determination (R2) for the equation: SWE = aPDO + bPNA + cNP + d is also given. All coefficients which have a p < 0.05 are marked in bold.
Table 6 – Squared Pearson linear correlation coefficients (R2) for the correlations between April 1st SWE for the top five performing snow survey sites and each of the four climatic indices. The coefficient of multiple determination (R2) for the equation: SWE = aPDO + bPNA + cNP + d is also given. All coefficients which have a p < 0.05 are marked in bold.
Discussion
The bottom line is: do not rely on ENSO to predict the snowpack depth in the winter to come. The other three indices (PDO, PNA and NP) either alone or combined do a much better job of predicting both February 1st and April 1st SWE at the provincial, regional and individual site scales. Overall, April 1st SWE showed better correlations than February 1st SWE with all four climatic indices. For the most part a combination of PDO, PNA and NP indices will give you the best indication of the winter and spring snowpack to come. For the Upper or Lower Fraser regions in April, your best bet is with NP. Finally, if you like to ski in the Columbia region in February, it’s PNA all the way.
What about the effects of climate change? Well, certainly as our climate continues to change at an accelerated rate, the use of historical climatic data to predict the future becomes less valid. Most climate change models (and there are many) agree that as our climate continues to change, we are going to see more extreme weather patterns. The good news is this means more epic winters like 1999. The bad news is we’ll also see more winters like last year and yes, I realize that it was only extremely bad on the coast. But now that we have these new prediction tools under our proverbial belts we can better decide in the fall whether to buy a new pair of fat boards or spend the money on airfare to South America.
Outlook for next winter? Well, I hesitate to make any predictions because things aren’t looking good and I don’t want to be the bearer of bad news. As of June 2005 the PDO and PNA indices were in a strong positive phase while the NP index was weak, and remember PDO and PNA are negatively correlated with SWE while NP is positively correlated. Anyone interested in a climbing trip to Chile?
Acknowledgements
I would like to thank Dr. Bruce Jamieson for proofreading this article and for providing statistical expertise. I would also like to acknowledge Dr. Dan Moore for providing the idea and proofreading the original draft of this article.
References
Cayan, D.R., and D. H. Peterson. 1989. The influence of North Pacific atmospheric circulation on streamflow in the west. Aspects of Climate Variability in the Pacific and Western Americas, Geophys. Monogr. Ser., 55, 375- 397.
Cayan, D.R., and R. H. Webb. 1992. El Niño/Southern Oscillation and streamflow in the western United States . El Niño: Historical and Paleoclimatic Aspects of the Southern Oscillation. Cambridge University Press, New York, USA. pp.29-68.
Chagnon, D., T. B. McKee and N. J. Doesken. 1993. Annual snowpack patterns across the Rockies: Long-term trends and associated 500-mb synoptic patterns. Mon. Wea. Rev., 121, 633-647.
Dracup, J.A. and E. Kahya. 1994. The relationships between U.S. streamflow and La Niña events. Wat. Resour. Res, 30, 2133-2141.
Koch, R.W., C. F. Buzzard and D. M. Johnson. 1991. Variation of snow water equivalent and streamflow in relation to El Niño/Southern Oscillation. Proceedings of the1991 Western Snow Conference, April 12-15, Juneau, U.S.A. pp. 37-48.
Mason, S. J. and L. Goddard. 2001. Probabilistic precipitation anomalies associated with ENSO. Bull. Amer. Meteor. Soc., 82, 619–638.
McCabe, D. J. Jr. 1994. Relationships between atmospheric circulation and snowpack in the Gunnison River basin, Colorado. J. Hydrol., 157, 157-175.
Moore, R. D. and M. N. Demuth. 2001. Mass balance and streamflow variability at Place Glacier, Canada, in relation to recent climate fluctuations. Hydrol. Processes, 15: 0-0 (2001).
Moore, R. D. and I. G. McKendry. 1996. Spring snowpack anomaly patterns and winter climatic variability, British Columbia, Canada. Wat. Resour. Res, 32, 623-632.
Patten, J. M., S. R. Smith and J. J. O’Brien. 2003. Impacts of ENSO on snowfall frequencies in the United States. Bull. Amer. Meteor.Soc., 18, 965–980.
Redmond, K. T. and R. W. Koch. 1991. Surface climate and streamfl ow variability in the western United States and their relationship to large-scale circulation indices. Wat. Resour. Res, 27, 2381-2399.
Ropelewski, C. F. and M. S. Halpert. 1996. Quantifying Southern Oscillation–precipitation relationships. J. Climate, 9, 1043– 1059.
Renwick, J. A. and J. M. Wallace. 1996. Relationships between North Pacifi c wintertime blocking, El Niño, and the PNA pattern. Mon. Wea. Rev., 124, 2071-2076.
Sittel, M. 1994. Differences in the means of ENSO extremes for maximum temperature and precipitation in the United States. Center for Ocean–Atmospheric Prediction Studies Tech. Rep. 94-2, Florida State University, 50 pp.
Smith, S. R. and J. J. O’Brien. 2001. Regional snowfall distributions associated with ENSO: Implications for seasonal forecasting. Bull. Amer. Meteor. Soc., 82, 1179–1191.
Trenberth, K. E. and J. W. Hurrell. 1994. Decadal atmosphere-ocean variations in the Pacifi c. Clim. Dynam., 9,303-319.
Yarnal, B. and H. Diaz. 1986. Relationships between extremes of the Southern Oscillation and the winter climate of the Anglo–American Pacific coast. J. Climatol., 6, 197–219.
Zhang, Y., J. M. Wallace and D. S. Battisti. 1997. ENSO-like interdecadal variability: 1900-93. J. Climate, 10, 1004-1020.
Tags:
avalanche journal
cam campbell
el nino
enso
snowpack depth
Permalink
| Comments (0)
|
|
|
Posted By Administration,
January 20, 2021
|
From volume 84, spring 2008
By Thomas Exner1 and Bruce Jamieson2
ASARC – Applied Snow and Avalanche Research, University of Calgary
1 Dept. of Geoscience, University of Calgary
2 Dept. of Civil Engineering, University of Calgary
Many people associate snow pack warming with spring-like conditions, when snow temperatures are close to 0°C and the likelihood of wet avalanches increases rapidly as soon as the sun softens up the melt-freeze-crust that often forms during cool nights. This is a common scenario in spring, when signs of warming, such as relatively warm air temperatures, strong solar radiation, and moist surface snow are easy to observe. But, what happens to a cold, dry snow pack that warms up significantly at air temperatures below zero?
In this article we discuss a few concepts of stability changes caused by daytime warming and summarise results from reported avalanches mainly caused by solar warming of a dry snowpack. These cases are quite rare, but under the right conditions warming can be the significant factor decreasing stability. According to a Swiss study (Harvey and Signorell, 2002) in 20% of 128 avalanche accidents in the Swiss Alps, daytime warming was the only factor contributing to avalanching. On those days no significant amount of new snow or recent wind loading was reported. Of course, maybe in some of those cases there may have been just a lingering instability, which could have been triggered by a skier regardless of the warming. However, the 20% suggest a significant correlation to the influence of warming. 
Figure 1: Figure 1. This dry slab avalanche was triggered on a cold, sunny day by a skier on a steep south-west facing aspect. Solar warming may have contributed to this release. (photo: ASARC)
What are the sources of warming that can rapidly increase the temperature of near surface layers?
The main warming sources that effectively are able to increase avalanche danger are solar warming, rain, and warm, strong winds. Rain is probably the most efficient way of adding heat to the snowpack (Marshall and others, 1999). It destabilizes the snow pack in a short time, can penetrate down to deep layers, and affects all aspects. Luckily, mid-winter rain events are rare in alpine regions in most places in Western Canada. Warm, dry winds, such as the Chinook are known to cause rapid warming of the near surface layers and may reduce snow pack stability. But, these warm wind events are infrequent, except on the eastern slopes of the Canadian Rockies.
The most frequent cause of near surface warming seems to be direct solar radiation. It can warm up the upper layers of the snow pack rapidly within hours and affect the stability of the snowpack down to about 30 to 50 cm (McClung and Schaerer, 2006, p.38). By softening the surface layers, loads (e.g. skiers or snow boarders) may even affect deeper layers. Thin clouds may intensify the heating effect by trapping radiation between the snow pack and the clouds (greenhouse effect).
The effect of time
Usually, warming of a dry snowpack is associated with increased settlement of the snow pack, and non-persistent (storm snow) weak layers are believed to be stabilizing under these conditions. This seems to be the case as long as the settlement happens slowly and gradually (McClung and Schweizer, 1996). Settlement and creep are always connected with a deformation of the snowpack, and snow as a material can adjust to slow changes in deformation without damage. However, fast deformation, as sometimes observed during rapid warming events, can result in collapse of the snow micro-structure (bonds are breaking faster than new bonds are forming), and a layered snowpack may release slab avalanches.
So, slow warming and settlement of the snowpack usually promotes stability. But, of course, there is an exception to this rule. Imagine for example a surface hoar layer, buried under a layer of low density snow with low cohesion (Fig. 2). No matter how hard a skier, boarder or snowmobiler hits this layer there is no slab to release. But with ongoing settlement, even when slow and gradual, the overlying layer(s) will increase in stiffness and density (become “slabby”). Now it may not take a lot to trigger and propagate a fracture in the surface hoar layer, and release a slab avalanche. This process requires a pre-existing persistent weak layer, such as the surface hoar layer.
In most cases when rapid solar warming, within a few hours or so, increases avalanche danger the slab/weak layer combination is mostly already like a “loaded gun.” The warming speeds up the creep of the slab on the weak layer just enough to possibly trigger a natural slab avalanche. Keep in mind we are still talking about a dry, sub-freezing snowpack. Once the snow surface starts to melt we are dealing with moist or wet point releases, which are a different story not addressed in this article. However, there are few cases where rapid solar warming significantly decreased stability, even though an obvious weak layer was not observed. The following section summarizes the conditions when this phenomenon was observed.
Figure 2. Even a prominent surface hoar layer with loose, low density snow on top is not releasable (left); neither by a skier nor as a natural avalanche. After the surface layer settles into a slab a fracture can propagate along the weak layer and release a slab avalanche (right). Daytime warming accelerates the settlement process and may act as a trigger.
Low density snow and rapid solar warming
According to the results of a survey conducted amongst 35 experienced avalanche practitioners in the fall of 2006, numerous reports of solar warming related avalanches followed a similar pattern. In all of these cases obvious signs of instability (shooting cracks, whumpfing and skier-triggered avalanches) developed during a short period of strong solar warming after the snow pack initially appeared to be stable and, interestingly, no obvious weak layer was observed initially. A few of these cases were reported by mechanised skiing operations, where a run was skied several times during the warming period. Snowpack observations ranged from no signs of instability on the first run to shooting cracks and triggered slabs within hours on the following runs. The following list summarises conditions, each of which were reported in a number of incidents.
We assume that rapid solar warming and settlement stiffened up the near-surface layer and so turned into a releasable slab (Fig. 3). A buried, subtle storm snow layer may have turned into a reactive sliding surface with the stiffening slab on top. With ongoing warming this temporary stage of instability probably stabilizes subsequently due to strengthening of the storm snow layer. Potentially, the interface of the warmer and denser layer overlying the still colder and less dense layer may have acted as the weak layer. Attempts to model this interface with a numerical snowpack model have been inconclusive so far. The idea of a storm snow layer becoming the reactive weak layer seems to be more likely. 
Figure 3. A cold low density layer can settle in to a reactive slab within hours caused by strong solar radiation. A subtle storm snow layer or just the interface of the stiffer, warmer layer above the low density snow may become the weak layer. We set out to track down these warming events and gather more detailed data over a limited number of days during the winter of 2006/07. So far, we have not been able to observe this phenomenon. Even when conditions seemed right, we only observed the settlement and stiffening of the surface layer but could not fi nd any signs of decreasing stability. So, what happened? It seems like this scenario is a complex interaction of many factors, such as warming rate, temperature range, snowpack properties, presence of an initially subtle weak layer, slope angle, aspect, and so on, which is so far poorly understood. In some of our observations some clouds may have delayed the warming or snow temperatures were too high, softening the slab and preventing propagation. Nevertheless, the reported cases seem to suggest that solar radiation can temporarily promote slab avalanching without a pre-existing obvious weak layer. The case where an obvious persistent weak layer (e.g. surface hoar, rain crust), with a stiffening layer on top, turns into a reactive slab is a more common scenario and easier to recognise, even though experienced people have been surprised by it. Once the slab on such a layer has formed, unstable conditions can prevail for quite a while. In most of the cases reported here, the temporary stage of increased avalanche danger may just last for a few hours or so. The storm snow layers, or perhaps the interface gains strength quite rapidly with ongoing settlement and warming. Other recent observations In this winter season of 2007/08, a number of natural slab avalanches released in January above ice climbs in the Rockies on steep sunny aspects. Most of these avalanches released in the first few days after a storm on a sunny day and air temperatures were well below zero. Usually, at this time of year it is quite uncommon that solar radiation releases slab avalanches. Perhaps the combination of the weak snowpack in the Rockies this winter and still sufficiently strong solar radiation on steep sunny aspects was a factor in releasing these avalanches. Given the weak, unstable snow pack even the low January sun provided enough warming to act as a trigger. In the spring time it is more common for avalanches above ice climbs to start as moist point releases and may eventually step down to a weak layer and release a slab avalanche. Snowpack warming model – SWARM Most of the above reported scenarios showed air temperatures well below the freezing point, and obvious clues such as a moist snow surface and snow balling were missing. Without many years of experience these warming conditions are hard to recognise and can easily be overlooked, but still can lead to a significant increase in avalanche danger. From field observations we know that only a few degrees difference in slope angle or aspect have a strong effect on the amount of heat the snow surface layers absorb. This winter for instance, we observed a sun crust on steep south-facing terrain above 40° or so on a cold day in January with air temperatures in the -15 to -20°C range. On parts of the slope with only a minor change in angle or aspect the snow surface was still dry. Laura Bakermans, a former grad student with ASARC, developed a snow pack warming model (SWARM) based on extensive temperature measurements of near surface layers to evaluate the influence of solar radiation depending on slope angle, aspect and time of year (Bakermans, 2006). Of course, it is not only the amount of daytime warming possibly raising avalanche danger on warming days. There are many other contributing factors. However, solar daytime warming is often underestimated on cold days when signs of warming are not obvious. Experienced people may know through intuition, based on many years of experience, when warming effects come into play. SWARM may help to train your intuition and shorten this learning process. Hogarth (2001), in his book “Educating Intuition”, would describe avalanche terrain as a “wicked” learning environment, since feedback is not always immediate or obvious, and it can have high consequences. On days when warming may be an issue it is probably wise to leave a wider margin of safety. There is still a lot to learn about the interaction of daytime warming and slab avalanching. SWARM is freely available for download on the ASARC web page (http://www.schulich.ucalgary.ca/cgi-bin/ENG/TrackIt.pl?SWarm.xls). Feel free to contact us if you have any questions, suggestions or comments. Acknowledgements Many thanks to all guides and forecasters, who kindly shared their knowledge and experiences on warming-related avalanches. References Bakermans, L., B. Jamieson. 2006. Measuring near-surface snow temperatures changes over terrain. Proceedings of the International Snow Science Workshop in Telluride, Colorado, 377-386. Harvey S., C. Signorell. 2002. Avalanche accidents in back country terrain of the Swiss alps: New investigations of a 30 year database. Proceedings of the International Snow and Science Workshop, Penticton, B.C. The Canadian Avalanche Association. Hogarth, R.M. 2001. Educating intuition. The University of Chicago Press, Chicago, U.S.A., 357 pp. Marshall H.P., H. Conway, L.A. Rasmussen. 1999. Snow densification during rain. Cold Regions Science and Technology, Volume 30, Issues 1-3, 35-46. McClung, D.M. , J. Schweizer. 1996. Effect of snow temperatures on skier triggering of dry slab avalanches. Proceedings of the International Snow Science Workshop in Banff, Alberta. Canadian Avalanche Association, Revelstoke, BC, 113-117. McClung, D.M., P.A. Schaerer. 2006. The Avalanche Handbook. The Mountaineers, Seattle, Washington, U.S.A., 342 pp.
Tags:
avalanche research
bruce jamieson
dry slab avalanches
solar warming
thomas exner
Permalink
| Comments (0)
|
|
|
Posted By Administration,
December 16, 2020
|
From volume 113, fall 2016 By Julie McBride FOR MARMOT BASIN, Friday, January 29, 2016 marked the end of a nearly two-month drought. Although November blessed us with a dump of snow during our opening week, December and January had forsaken us. Our last appreciable snowfall had been seven weeks prior on December 9. The arrival of the much anticipated storm was also the harbinger of a human-triggered avalanche cycle from the Icefields Parkway to McBride, BC. A total of five separate events involving avalanche professionals as well as recreationists all occurred within a 200km radius of Marmot Basin. It was a busy day in the avalanche world near Jasper, one that would ultimately cast a sombre shadow over our operation for the remainder of the season.
During the drought, temperatures had ranged from just below –20°C to just above freezing with a week of sustained cold. With less than 90cm of snow on the ground, Marmot’s was a textbook continental snowpack—shallow and weak, facets throughout, sitting on a base of depth hoar. Although the “storm” delivered only 8cm of snowfall in 24 hours, it was accompanied by moderate to extreme southerly winds, that formed a new storm slab. Friday, January 29 was our first avalanche control morning in weeks. 
PHOTO: AERIAL SHOT OF MARMOT BASIN // MARMOT BASIN
As the forecaster that morning, my first priority was an Avalauncher shoot that produced results from size 1 to 2.5, with the larger releases initiating in the storm slab and then stepping down to a layer of facets and depth hoar, 50-70cm down. Satisfied with these results, I turned my attention to Charlie’s Bowl.
A northeast to southeast-facing alpine bowl with a series of steep, rocky chutes below its entrance adjacent to the Knob area, Charlie’s Bowl had not yet opened for the season. In mid-November, Chutes 5 through 7 had released to ground during a natural cycle. A week later, Chutes 5 and 6 failed to ground with explosive control work. With more explosives in December, Chutes 6 to 9 released to ground for a third time. By mid-January, ski cuts produced only small results in isolated pockets of thin wind slab. We began ski compacting and waited for more snow to open Charlie’s to public. Late in the afternoon on Thursday, January 28, with over 100 sets of tracks around me, I stood at the top of the Chutes, snow and wind obliterating my visibility, hopeful that we might be getting close.
The first two one-kilogram hand charges in Charlie’s Bowl on the morning of the 29th produced no results. Two more 1kg charges, deployed simultaneously at either end of a broad apron above the Chutes, also failed to produce a result. With no more explosives, I proceeded to ski cut from my position at the top of Chute 8. Once I was clear, my partner, one of our avalanche technicians, did the same in Chute 5. While ski cutting we both noted a 10-15cm thick, 1F slab that was penetrable on skis, but no signs of fracture propagation or releases other than small fist-sized slab cookies. Then I decided: the avalanche tech would take two patrollers and continue ski cutting in Charlie’s to break up the slab, while I moved on to another area with a third patroller.

PHOTO: CHARGES LARGE AND NUMEROUS // MARMOT BASIN PATROL
Minutes after we’d parted ways, I got a call over the radio from one of the two patrollers in the Chutes: “We’ve had a deployment; he’s on top…” Oh shit. The tech had gone for a ride. Then a second call from the tech: “I’m ok.” Thank God.
As the tech skied into Chute 6, a small pocket of wind slab had propagated into the rocks above him and then stepped down to ground. With no escape, he’d deployed his air bag and was swept by a size 2 for nearly 200m to the flats at the base of the chutes. Spotting from above, his partners reported that he’d been on top of the slide the entire time and that when it came to a stop, he appeared to be sitting upright in the debris, his legs buried to the hip. He had lost both skis and one pole but was able to selfextricate. By the time his partners had made their way to him, he was free and clear of the runout zone, a bit shaken but understandably so. Although he had tweaked his lower back while twisting to release from his skis, he had somehow managed to otherwise emerge physically unscathed from a rather nasty ride through some very thin, bony terrain.
No stranger to ski cutting, it was the tech’s third involvement during his seven-year tenure at Marmot. His propensity for triggering avalanches was already well established. At 6’8” and 260lbs, he has been known to trigger slopes where even large explosives have failed. His skis sink deep into the snowpack and he has a knack for finding the sweet spot.
In addition to his formidable stature and reputation, his pursuits outside of work invoke similar images of unbreakable nerve and strength: base jumping, parachuting and backcountry sledding. This is someone who had been hired as an avalanche tech not only for his knowledge and experience, but also for his ability to remain stolid and clear-headed in stressful situations. It came as no surprise that after debriefing with the control team he was ready to get back on the horse, so to speak.
Back at the top of Chute 6, he gladly volunteered to place a 6.75kg sack of explosives into the hangfire. The shot cleaned out what was left, taking Chute 7 to ground along with it and releasing the thin storm slab in Chutes 8 and 9, which ran over top of the ski cuts in Chute 8 from a few hours earlier.
PHOTO: A SA IN CHUTE 6 AT MARMOT BASIN // JASON RECHNER
That afternoon, details of other larger events to the south and to the west of Marmot began to circulate on the news and within industry channels. A Visitor Safety Officer from Jasper National Park had been involved in a skier-accidental size 3 that deposited nearly two metres of debris on the Icefields Parkway near Parker Ridge, closing the highway. And at least 15 snowmobilers from three separate groups were involved in a size 3 machine accidental near McBride that resulted in the deaths of five snowmobilers.
Amidst these rumours and half reports I went home that night and contemplated the decisions I had made that day: where I had failed, what I could have done differently, what I had learned, what I would do differently now, what I would do in the future. My head reeled from the cerebral merry-go-round.
As avalanche professionals we spend a great deal of time talking about avalanche problems and avalanche hazard, and how things like variability, uncertainty and confidence play into our analysis of what the problem or hazard actually is. We also talk about human factors: nebulous sub-conscious phenomena that can sometimes lead us to miss or misinterpret pieces of information, or bias our intuition and instincts. Even though we employ various tools, decision aids, methods and procedures to avoid mistakes of both the analytical and the human kind, sometimes unexpected or unlikely things happen. Sometimes we get caught in slides. That is just the nature of snow on steep slopes. And it is why we also practice and teach avalanche rescue skills. There is always uncertainty and sometimes we get it wrong.
While I knew that my decision to continue ski cutting that morning had turned out to be a bad one, the reality is that the possibility of going for a ride exists every time I or someone else ski cuts a slope. Still I couldn’t help feeling that I’d let the team down, in particular the tech who had been the victim of my decision. An element of complacency had crept in during the drought. Having seen little change from day to day for seven weeks, I’d underestimated the effect of a little bit of new snow and some wind on our deep persistent layers and what a light trigger in the right spot could do, even in worked terrain. My confidence was rattled. Our snowpack was weak and unpredictable, and the head forecaster and I resolved to punctuate future
control missions with larger explosives.
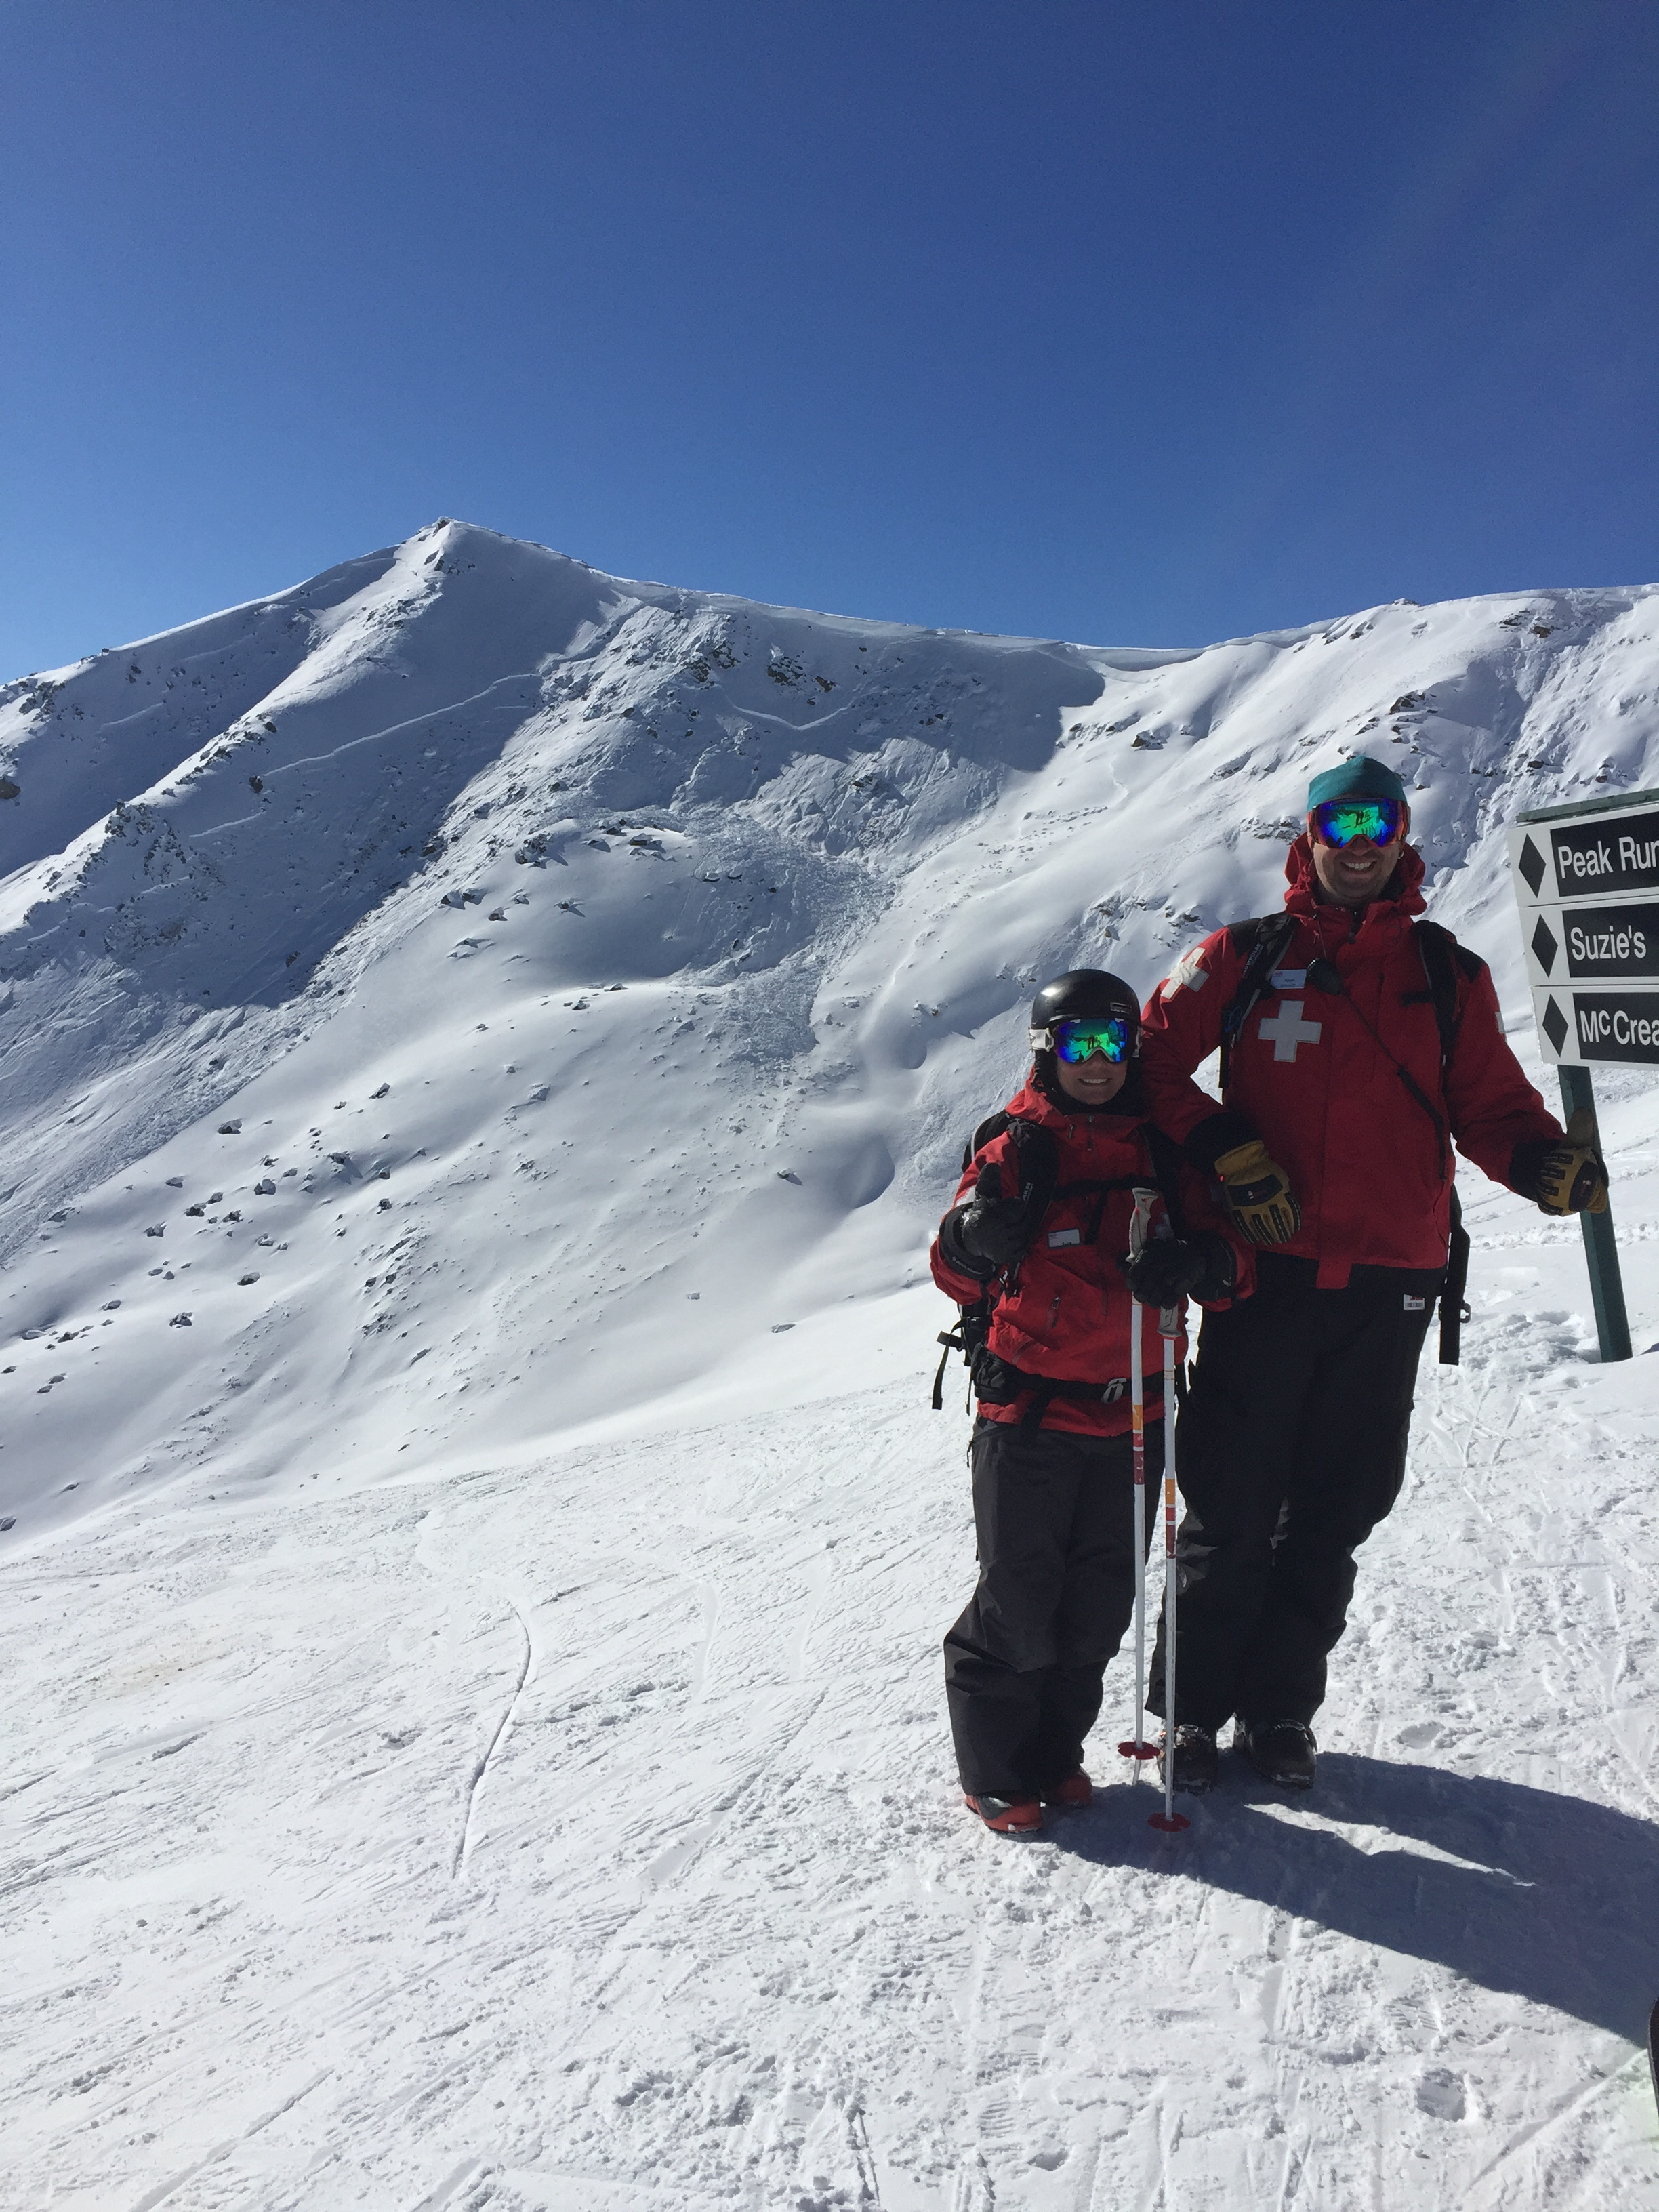
PHOTO: JULIE AND THE TECH INVOLVED // JASON RECHNER
In the week that followed, it was obvious that the tech who’d been involved was clearly struggling to deal with how he had been affected. He was having trouble sleeping, he was having nightmares, his hands trembled, his head just wasn’t in the game and the pain in his lower back had worsened. We sent him to a doctor, a physiotherapist and a critical incident stress counsellor. We filed a workers’ compensation claim and he was placed on light duties.
The physiotherapy sessions continued, the counselling sessions continued. Weeks passed, then months. His mood and progress seemed to ebb and flow. Every day was a different day, each with possibly a different challenge. He started experiencing panic attacks. He was frustrated. With no manual, tools or methods guiding us in supporting him, we—his supervisors—were frustrated. We talked, we talked with him, we talked with our managers, we talked with WCB, then we talked some more. I suggested that perhaps some time completely away from the work environment would help. He opposed; he felt that his anxiety was something he had to face head on and that stress leave would be counterproductive to learning how to overcome it. I was skeptical but conceded. After all, I was no expert and I admired his dogged determination. He was doing everything right. And while he struggled, the rest of us carried on, not for lack of compassion but for lack of other options.
The season continued much as it had begun, with little snowfall and low confidence in our snowpack. We opened most of our avalanche terrain eventually. Large and numerous explosives continued to produce large avalanches running on deep persistent weaknesses. We were cautious and conservative. Temperatures remained above freezing throughout most of April. An impressive iso-cycle ripped out moguled runs down to the basal depth hoar; our suspicions were vindicated. As we packed up our gear on our final day of the season, the tech was clearly still struggling. I watched the panic wash over his face when someone deployed an avalanche airbag for summer storage, triggering a flashback and the anguish of his trauma. My heart broke. It’s the last day, what happens now?
The tech has since been diagnosed with an adjustment disorder. Over the summer worked with a team of professionals (a psychologist, occupational therapist and a physio/personal trainer) overseen by a specialist in traumatic psychological injuries. It is still a long road ahead but one that he is facing with courage and optimism. He is Hercules to me, and like all parables his trials hold a lesson for us.
When avalanche professionals talk about human factors, we need to talk not only about what goes on in the subconscious prior to our decision of whether or not to ski into a slope, but also potential consequences of that decision at the psychological level as well. Although we find it easy to casually discuss the physical consequences of an avalanche with euphemisms such as “raked through the trees” or “cheese-grated over the rocks,” we rarely discuss how the same event might affect one’s mental health. Or if we do, it is often in hushed voices, behind closed doors: “Why can’t she just deal with it?”
That is because psychological or mental health issues of any kind have a stigma in society in general. It’s not polite to talk about the elephant in the room or the crazy uncle in the attic, so to speak. And this is precisely the reason why we need to talk about it, because the patroller who goes to a wreck or the tech who goes for a ride or the guide whose guest gets buried might not be able to. They might not even recognize that they’ve suffered a traumatic psychological injury, never mind have the strength to admit it to themselves and ask for help. As their supervisors, we need to build our knowledge and understanding of “mental health first-aid” and have these tools in our proverbial tool-boxes when we start the conversation.
Tags:
avalanche
avalanche incident
human factors
marmot basin
Permalink
| Comments (0)
|
|
|
Posted By Administration,
September 23, 2020
|
From volume 102, winter 2012-13 By Rod Gee My 25 year glide slab education began on an early morning in January 1989. A snowplow operator on Highway 16 west of Terrace reported witnessing a Size 3.5 airborne wet avalanche cross the railroad and highway corridors.
The deposit pushed sections of concrete guardrail into the Skeena River. Fortunately, no one was involved. I arrived at the site shortly after hearing the plow operator’s report. “Argh! It’s the glide slab I’ve been monitoring for the last week," I thought; "Why this morning? It’s notraining, and it’s not warm. Why did it run now? Were there indicators I’d missed?”
I came to the north coast of British Columbia to work in CN Rail’s Skeena avalanche program. I brought seven years of work experience in the Rockies, and ITP training in the Selkirk Mountains and the Coast Ranges. However, I had minimal knowledge of glide slab behaviour.
Glide slab prediction is a challenge, compared to the relative predictability of most maritime snowpack avalanche activity. They are classic poster children for the discussion surrounding why “Hazard Level 2” is perhaps a better descriptor than “Stability Good, with the occasional size 4.” Without start zone instrumentation monitoring glide rates, the CN Skeena program offsets uncertainty to some degree with frequent explosives control, and, where effective, runout zone earthworks. 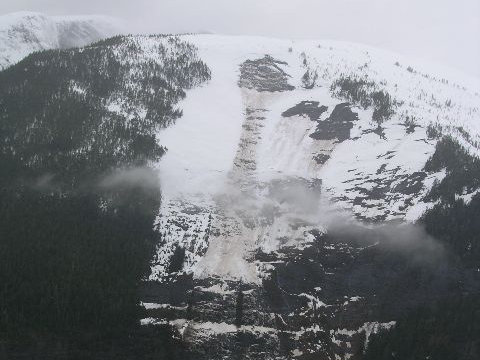
Glide slab explosives control results, 50 mile path. Skeena River corridor, west of Terrace, BC // Rod Gee
These are some of the observations on formation and natural initiation I now use to evaluate glide slab stability:
- A low-friction ground surface is important for slab formation, but the degree of support from terrain features immediately below the slab is at least as important for slab failure.
- Rapid, early season snowpack accumulation associated with relatively warm air temperatures increases the likelihood of early- and mid-season glide slab formation.
- Lack of an effective ground freeze prior to snowpack accumulation results in increased mid-winter glide rates.
- Rainfall and meltwater percolation in an isothermal starting zone snowpack may accelerate glide rate by decreasing friction at the slab/ground interface. Free water may also decrease the strength of the supporting snow downslope of the glide slab as well as the slab itself. Rain falling into the glide crack above the slab, likely has a similar net effect. However, rain does not guarantee slab failure; it is only part of the equation.
- Glide slab failure does not require an isothermal snowpack. Failure may occur before the snowpack becomes isothermal or during the overnight cooling phase of the diurnal cycle, and without free water being present at the snow/ground interface.
Explosives Initiation
The ideal condition for explosives control occurs when the slab itself maintains a degree of strength greater than that of the snowpack below the toe and along the flanks of the slab. In an ideal scenario, a combination of terrain and weather factors unbalances the downslope snowpack stress/strength relationship to a greater degree than within the slab itself. The toe and flanks are now barely able to support the loading of the gliding slab. Explosives applied at this time cause slab initiation by triggering a failure of the snowpack at the toe of the slab.
Technicians Herb Bleuer and Mike Zylicz began experimenting with charge quantity and placement in the Skeena corridor in the early 1980s. They realized that conventional charge quantity was usually insufficient for glide slab initiation, and that charge placement was extremely critical. They also realized that placing the explosives charge into the glide crack above the slab was ineffective because that was not where the stress/strength relationship was deteriorating. Effective glide slab control is about “kicking the knees out” from under the slab, and not adding load to the slab itself. Their testing produced reasonable results using 100-150kg ANFO charges placed at the toe of the slab.
The best charge placement is a very specific point where the gliding slab is having the greatest effect on the non-gliding downslope snowpack. Current Skeena corridor glide slab control strategy includes the use of charges of 150 and 500kg on 200-500cm deep slabs. Large charges are used
because they increase the likelihood of triggering, which reduces hazard at the runout zone transportation corridor and minimizes the likelihood of natural events disrupting rail operations.
That said, control is not always successful. A complex, ever-changing interplay of factors affects glide slab stability, and the puzzle is not completely understood. Some factors I consider in evaluating explosives control effectiveness include:
- Control is more likely to be successful on glide slabs poorly supported by the terrain below the slab. For example, a poorly-supported glide slab can be initiated with explosives so it will then trigger a better supported glide slab lower in the starting zone that does not respond to explosives.
- Rain or melt-water at the ground/snow interface is not essential for initiation to occur, but it does increase the likelihood.
- Initiating sections of glide slabs is useful both by reducing the deposit volume of a single occurrence, but also because it exposes the ground surface to solar radiation, which then potentially aids in increasing glide rate by introducing more heat into the slab’s basal layers.
- The strength of the snowpack below and alongside the slab allows the slab to glide a significant distance downslope without failing. Increasing glide rate may indicate decreasing snowpack strength.
- A 300-600cm slab can easily glide 50-100m without initiating if the downslope snowpack and terrain accommodates the glide’s loading effect. Increasing glide rate and/or deteriorating strength of the snowpack supporting the slab are two critical initiation factors.
- Three reliable nearby indicator paths I use to assess an east aspect path prone to glide slab formation have a northwest aspect, but the starting zones are at the same elevation. This suggests ambient air temperature affects glide slab behaviour to a lesser, but still relevant, degree.
Prediction and control have improved since the 1980s, but we still include a healthy dose of “art” to the “science” of our craft. Explosives control in January 2012 put a size 4 deposit within 2m of the rail roadbed. Is our understanding of glide slab management improving, or were we just lucky on that mission?
Tags:
avalanche research
glide avalanche
glide cracks
glide slab
larry stanier
Permalink
| Comments (1)
|
|
|
Posted By Administration,
September 16, 2020
|
From vol 123, Spring 2020
By Simon Horton
HOW TECHNOLOGY TRANSFORMED WEATHER FORECASTING, AND WHAT IT COULD DO TO AVALANCHE FORECASTING.

AVALANCHE CANADA FORECASTER GRANT HELGESON TESTS SOME PROTOTYPE FORECASTING TOOLS. // ALEX COOPER WEATHER FORECASTING HAS RADICALLY transformed over the past century. In the 1920s, field observers reported current weather conditions back to meteorologists, who would draw up weather maps and extrapolate the weather for the next few days. Fast forward 100 years and precise forecasts are possible in mountainous terrain thanks to a global network of earth observations, advances in scientific understanding, and some of the most powerful supercomputers in the world.
This raises the question, will avalanche forecasting head down a similar transition from field-based to computer-based work?
Certainly not anytime soon, but some form of technological progression is inevitable. The transition for weather forecasting took decades, starting around the time of the Second World War. Growth in aviation enhanced our interest in the atmosphere, that in turn changed our perspective of the weather. In the decades that followed, space exploration led to weather satellites that gave us an even broader view of the atmosphere. Then, early computers began crunching numbers to help with these extrapolations.
Despite these technologies, weather forecasting remained deeply rooted in experience-based pattern recognition for several more decades. By the 1970s, computer models began giving reasonable upper air forecasts (such as jet stream forecasts), but the Second World War-era style of human-centric forecasting still prevailed. the tides turned in the 1980s and 1990s when computer forecasts became more accurate and forecasters eventually learned when they
could and could not trust them. Trust in the ability of computer models to accurately predict weather continues to grow.
Avalanche forecasting currently relies on manual field observations and experience-based pattern recognition comparable to methods used by Second World War-era weather forecasters. However, over the past decades, the avalanche research community has developed remote sensing and computer modelling methods that have similar potential to observe, understand, and predict avalanche conditions. These technologies are at a similar status to weather forecasting technologies from the 1960s or 1970s. New methods are becoming available, but we don’t really know how to implement them into daily work.
As we saw in weather forecasting, these barriers were eventually overcome as the technology improved. We can speculate what a future avalanche forecasting system might look like by looking at how similar technology transformed weather prediction. 
OBSERVATIONS AND PREDICTIONS
Modern weather forecasters use interactive dashboards that combine field observations, satellite imagery, and computer predictions to form a comprehensive picture of current and future weather conditions. Could this be what our workspaces look like in the future? Maybe instead of simply reviewing field observations from your own and neighbouring operations, a future avalanche forecasting tool will combine these observations with automated maps of avalanche activity, virtual snow profiles, and computer predictions of future conditions. to help form a more comprehensive picture of avalanche hazard. Even if it’s speculation, it’s important to understand the potential for technology to change avalanche work so we can shape it in a way that we all benefit.
The technologies impacting weather and avalanche forecasting broadly fit into two categories: ones that observe the conditions and ones that predict the conditions. In terms of observing conditions, weather satellites were the game changer that allowed us to expand from point observations to continuous spatial coverage. The same thing could happen with avalanche and snowpack observations. Networks of detectors that sense vibrations from avalanches are already installed, and recent research out of Europe has shown impressive accuracy in detecting avalanche debris in near real-time using radar-based satellites. Testing in Norway has found these satellites, which can even see through clouds, can provide updated daily maps of avalanche debris with complete spatial coverage across mountainous terrain. Imagine being able to see map of every avalanche that ran in Canada over the past 24 hours!
Remote sensors—from either satellites, aircrafts, drones, or on the ground—can also tell us about the snowpack. Deriving maps of snow-covered areas is already straightforward, but there is an increasing ability to sense snowpack layering remotely too. There are still many hurdles to getting actual x-ray vision into the snowpack—detecting thin weak layers is difficult, wet snow and crusts create a lot of errors, and all remote sensing technologies struggle in steep complex terrain. Advances in remote sensing are happening quickly, but most likely will need to be supplemented with other information to give us the best possible picture of avalanche conditions.
This is where prediction comes in. Our understanding of weather evolved in the 1920s with improved theories about the 3D structure of frontal systems. This didn’t have much impact on forecasting until several decades later when these theories were applied in computer models. This has become the backbone of modern weather forecasting.
Similar advances in snow science over the past decades have enhanced our understanding of how weak layers form, how avalanches release, and how they move downslope. The latest theories about snow microstructure and fracture mechanics are being implemented into computer models that simulate both the evolution of the snowpack structure as well as the movement of avalanches once they release. Could these models eventually have as much predictive power as weather models?
VIRTUAL SNOW PROFILES 
A VIRTUAL SNOW PROFILE CONTRASTED WITH A HAND DRAWN ONE // SIMON HORTON One promising forecasting application is computer models that simulate snow profiles with weather and terrain data. Some European countries started testing virtual snow profiles in the 1990s and Avalanche Canada started testing similar products 10 years ago with a focus on remote, data-sparse areas where the models could be driven with weather forecasts. (You may have seen these virtual profiles on ARFI.) Since their inception, the consistent question is, "How accurate are they?"
After 10 years of developing and testing these models for public forecasting in Canada, our impression is they provide a reasonable picture of general snowpack patterns, at least at some of the locations some of the time. Similar to how early weather models provided semi-realistic jet stream forecasts, the latest snowpack models can provide some big picture context to what is happening in the snowpack.
Weather models started being useful for big scale processes and we can expect snowpack models to follow suit. Rather than treating virtual profiles as slope-specific information, we can use snowpack models to look at regional differences in snowpack structure. For example, a surface hoar layer may form in the northern Monashees but not the southern Monashees because a storm tracking along the U.S. border causes too much cloud cover for surface hoar to form. Current applications of virtual snow profiles can already resolve some of these big-scale patterns. A focus of the avalanche research group at Simon Fraser University is developing ways practitioners can visualize and understand these patterns.
Weather models eventually grew from basic advisory tools to predictive powerhouses. A big reason they became more accurate in the 1980s and 1990s is they were fed with more observations of current atmospheric conditions. Uncertainties about the current weather (such as the initial conditions) is one of the main sources of errors in weather models. Over the past few decades, the amount of observations that could be collected by satellites, radars, and airborne sensors has exploded. Once the initial weather conditions are processed, computer models simply apply the laws of physics to figure out what will most likely happen next.
Similarly, the biggest source of uncertainty in snowpack models is figuring out when, where, and how much it snows. The most realistic virtual snow profiles are the ones at locations with good snowfall measurements or forecasts. Once snow is on the ground, the laws of physics do a pretty good job of figuring out how it evolves, but measuring and predicting snowfall is still hard, and even the best measurements and models currently fall short. We can expect to continue getting better at knowing how much it snows with better weather forecasts and observation networks. From there, we can get better at predicting the snowpack structure.
MERGING OLD AND NEW 
LEFT: METEROLOGY SERVICES OF CANADA RADAR IMAGE OF WESTERN CANADA // MSC RIGHT: WEATHER MAP FROM SCANDINAVIA FROM 1874 // WIKIPEDIA CREATIVE COMMONS Early weather models were considered advisory tools. Meteorologists would check their own jet stream forecasts against the computer forecasts to increase confidence in their predictions. Computer-based systems were brought into the loop to augment human capabilities rather than replace them. They were a thinking tool. What really changed the day-to-day operations of meteorologists was the development of tools that merged old methods with the new technology.
In the late 1990s, interactive computer dashboards were developed that allowed forecasters to visualize field observations, satellite imagery, and computer model forecasts all in one place. Bringing different sources of information together allowed forecasters to get the most complete picture, filter through all the information, and weight each type of data according to its strengths and weaknesses.
The InfoEx is a current example of a forecasting tool that helps us build an understanding of avalanche conditions based on field observations and analysis by fellow professionals. Perhaps a future version of the InfoEx could combine the information we currently use with satellite maps of avalanche debris and some fusion of a remotely-sensed and computer-simulated snowpack visualizations to give us a more complete picture of avalanche conditions. If designed effectively, such a tool should help us assess hazards faster, more efficiently, and more accurately.
There’s lots of talk about machine learning and losing work to automation. This is scary for a community that looks to the mountains for an escape from the chaos of the digitized world. These emerging technologies could change aspects of avalanche work, but they won’t automate it. The transformation of weather forecasting took decades, billions of dollars, and major international collaborations. Even with that, weather is (probably) still easier to predict than the delicate slope-scale processes that cause avalanches. Plus, meteorologists still have jobs—they just spend less time analyzing data and more time communicating and making decisions.
The hope is that integrating new technologies will improve our hazard assessments so we can focus our time and energy on risk mitigation. Computers are great at pattern recognition—better than humans in many fields—but thankfully avalanche forecasting is more than that. Computer predictions will need to be verified, interrogated, and interpreted by humans. Ultimately, the complex mitigation decisions are up to us. Field work may become more targeted, where the computer system identifies the greatest uncertainties that need to be resolved by sending field teams to answer specific questions.
There will certainly be a learning curve, perhaps a slow one, where we gradually learn what technology can offer. We should all be engaged to learn about how these technologies work and, more importantly, have our say on how they should be implemented so we can make informed decisions about the future of avalanche forecasting.
REFERENCES
Benjamin, S. G., Brown, J. M., Brunet, G., Lynch, P., Saito, K., and Schlatter, T. W., 2019. 100 years of progress in forecasting and NWP applications, Meteorological Monographs, 59, 13.11-13.67.
Eckerstorfer, M., Bühler, Y., Frauenfelder, R., and Malnes, E., 2016. Remote sensing of snow avalanches: Recent advances, potential, and limitations, Cold Regions Science and Technology, 121, 126-140.
Horton, S., Nowak, S., and Haegeli, P., in review. Enhancing the operational value of snowpack models with visualization design principles, Natural Hazards and Earth System Sciences.
Morin, S., Horton, S., Techel, F., Bavay, M., Coléou, C., Fierz, C., Gobiet, A., Hagenmuller, P., Lafaysse, M., and Ližar, M., 2019. Application of physical snowpack models in support of operational avalanche hazard forecasting: A status report on current implementations and prospects for the future, Cold Regions Science and Technology, 102910.
Tags:
avalanche forecasting
future
simon horton
technology
Permalink
| Comments (0)
|
|
|
Posted By Administration,
September 2, 2020
|
From volume 120, spring 2019 By Nadine Overwater 
COMMON AVALANCHE AREA SIGNAGE TO PROMOTE WORKERS NOT TO STOP ON ACCESS ROADS IN AVALANCHE THREATENED AREAS.
THE PATCHWORK ARTISTRY OF FORESTRY; we’re all familiar with cutblocks and recognize that they are the visible signs of resource extraction, like mine sites, hydroelectricity and its structures, and transportation corridors which move both people and raw materials. The cutblock is smaller but can have an impact on slope stability or open the possibility of avalanches in terrain that was not previously susceptible. Do foresters recognize, pay attention and care about the implications of creating these openings and corridors and the possibility of new avalanche terrain that may affect the workers, public and the environment?
By law, forest professionals are required to consider aboriginal interests, species at risk, old growth retention, wildlife corridors and connectivity, migratory birds, species and ecosystem diversity, visual quality, forest health, wildfire mitigation, terrain stability; the list of parameters to be considered in land management is long and complex. In a rugged and mountainous landscape, a winter site visit to a newly harvested block makes it evident that avalanche hazard is clearly a factor that also needs to be considered.
There is no legislation that specifically requires a forest professional to consider the possibility of creating avalanche terrain when designing cutblocks. The Forest Planning and Practices Regulation (FPPR 4:1(37) requires that forest professionals must design forest development considering terrain stability, which may also be interpreted to include snow stability. There is also The Land Managers Guide to Snow Avalanches in Canada (CAA, 2002) which outlines methods for recognition and planning of avalanche terrain, a helpful publication but lacking the rule of law. Obligations may be partially captured in the bylaws governing the Association of BC Forest Professionals which cites criteria to uphold the public interest, and practice professional duties with
competency, integrity and due diligence. This means that the public has trust in forest professionals to be able to undertake their job with the knowledge required. Areas where crown infrastructure exists or may be placed at risk, for example above a highway, are placed in a category where a qualifi ed registered professional must complete an assessment to ensure the slope will not be problematic in the future. The Ministry of Transportation brokered this deal and is described in a technical bulletin Snow Avalanche Assessments: the basic facts (ABCFP, 2002).
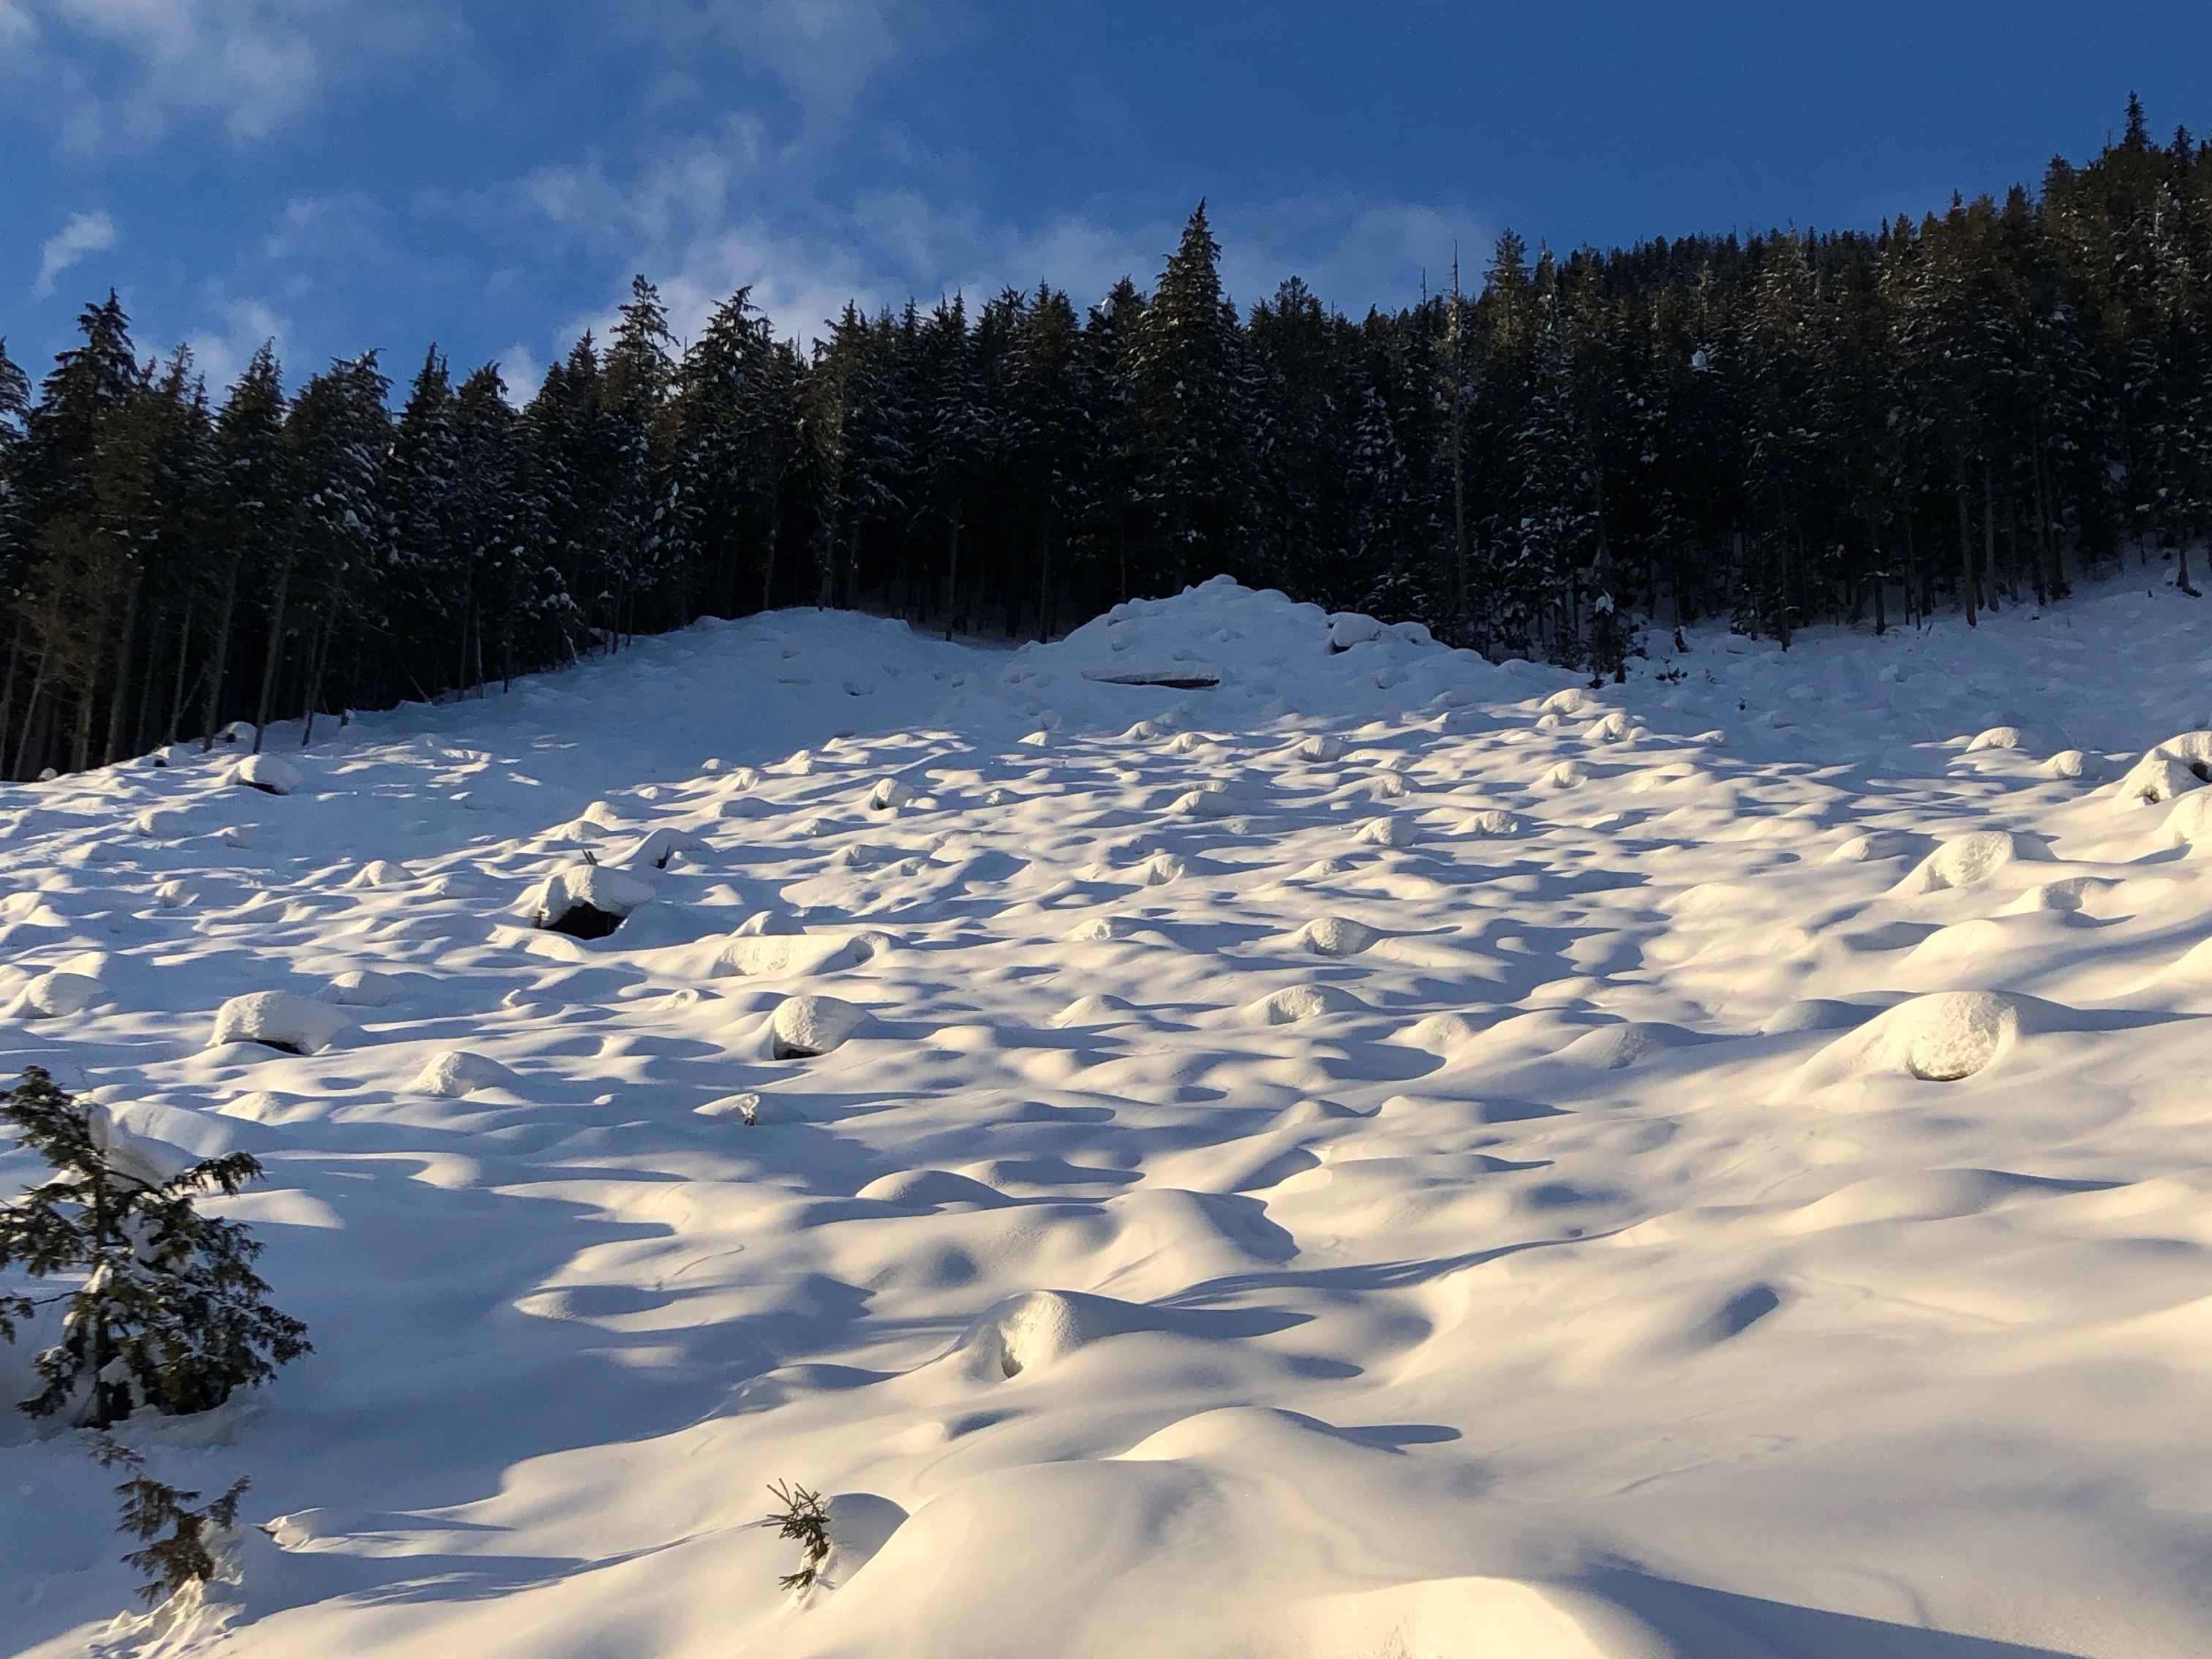
HARVESTED CUTBLOCK THAT HAS MINIMAL ANCHORS LEFT ON SLOPE. IS THIS NOW A MAN MADE AVALANCHE PATH?
I am a forest professional who is directly responsible for cutblock and road design in the heart of the Columbia mountains both north and south of Revelstoke, BC. In my opinion, a strong knowledge of avalanche terrain is required to work in many parts of our province (BC). Opening up steep hillsides above roads not only poses a threat to public and employees travelling below, but it makes it difficult for the newly planted trees to establish when they are prone to slide activity and snow creep continuously acting on the seedlings. There is the consideration of downslope resources as well, which very often include fish habitat and/or standing timber. It does not benefit the licensee or the public to create cutblocks that are prone to sliding.
Despite the legislative gap that does not require their consideration, it is my hope that most forest professionals doing work in avalanche territory reflect on the creation of new avalanche hazard when designing roads and cutblocks. There are mitigative strategies as well, that can be implemented when steep slopes cannot be avoided. One of these strategies is leaving behind high stumps - well beyond the threshold snowpack levels. This method has been successful in anchoring the snowpack until a new plantation is established and avalanche hazard is removed. The only downfall of this method is the wasted timber, left behind as two metre stumps. Cutblocks that are designed to be longer across the slope but have shorter length upslope, minimize the mass and velocity of any potential avalanche. Avoiding existing avalanche paths and the trim vegetation (or forest) along edges and above or below existing paths, helps prevent the creation of larger avalanche paths.
The Columbia Valley typically experiences a deep snowpack and regular avalanche activity. For those of us who work here, we travel through the landscape as professionals and as recreationists, so our awareness of avalanches becomes a subconscious element in our design decisions. Do all forest planners consider the creation of new avalanche terrain? What about foresters in the Okanagan, where the snowpack reaches one metre on a good year? How are areas with drier climates and lower annual snowpack being considered at the planning phase? What about the compounding effects of wildfires opening up the forest landscape? Suppose they are hit with an extreme winter and higher than normal snowpacks. What then? It is highly probable that avalanche activity could occur in areas that have not previously seen this type of disturbance. Hopefully, a design flaw like this can be caught at the geotechnical analysis stage; many terrain instabilities are related to slope and if it is recognized that the ground can move, then it becomes obvious that what sits on the ground can also move (disregarding ground roughness).
A major concern and problem that is faced by many forest planners today is the fact that the resources are getting further into the valleys and further up the slope. The generations before us have taken the “cream of the crop” and accessible timber. We are now faced with developing land that consists almost entirely of steep slopes and cable harvesting. I am not certain that all forest professionals have the knowledge of avalanche behaviour to be able to develop this type of terrain moving forward. I think that there is room for professional development to ensure that we are designing sustainable and safe forest openings. An idea that can be jointly approached by professional foresters, geotechnical engineers and avalanche technicians.
 MANY OF THE MOUNTAINS IN BRITISH COLUMBIA ARE BECOMING A PATCHWORK OF NATURAL AND MANMADE AVALANCHE CONCERNS. Steep slopes are an obvious concentration point, but what about those lower angle slopes? A final thought, and something that I feel may not be approached by all forest professionals, is the unfortunate creation of surface hoar farms, those lively sections of terrain created by the development of low and mid elevation cutblocks in sheltered valleys. Frequently we see cutblocks on low angle slopes with signs of natural slab avalanches in them, mostly size one, that terminate close to where they initiated. It is difficult to avoid making these cuts, but it is a problem, nonetheless.
I’m uncertain if there are design measures that can be utilized to mitigate surface hoar farms, and because they are low consequence events, they do not necessarily appear on the radar of the forest professional hanging ribbons and traversing boundaries through waist deep brush in the summer months. It could also be a topic worth pursuing moving forward in the world of professional development.
This is a personal take on the intersections of forestry and the avalanche industry. I cannot speak for anyone other than myself. However, I do believe that we have been successful in managing cutblock design when it comes to the creation of new avalanche paths. When I am driving, touring, hiking or flying through our valley I don’t find myself looking at failed designs and appalling scenes of recurring avalanches where they have never been before. Yes, there is the odd one and yes, I believe that there is room for education and advancement, especially in the face of climate change.
I do know that as forest professionals, we are bound to forest management objectives that best serve the public and the environment and that snow and slope stability are considered directly or indirectly in the planning process.
LOG HARVESTING ON THE MOUNTAIN SIDE DURING THE WINTER SEASON.
REFERENCES
Canadian Avalanche Association. 2002. Land Managers Guide to Snow Avalanche Hazards in Canada. Jamieson, J.B., C.J. Stethem, P.A. Schaerer and D.M. McClung (eds.). Canadian Avalanche Association, Revelstoke, BC, Canada
ABCFP & APEGBC Joint Practices Board, May/June 2002. Technical Bulletin Snow Avalanche Assessments: the basic facts. Forum. https://member.abcfp.ca/
WEB/Files/publications/FORUM-2002-3_avalanche.
pdf?WebsiteKey=4b6af123-da4f-4a97-a963-579ada9e595
5&=404%3bhttps%3a%2f%2fmember.abcfp.ca%3a443%2f
WEB%2fabcfp%2fFiles%2fpublications%2fFORUM-2002-3_
avalanche.pdf
Tags:
avalanche hazard
forestry
nadine overwater
Permalink
| Comments (0)
|
|
|
Posted By Administration,
August 26, 2020
|
From volume 75, winter 2005
By Tony Webster, Adventure Guide Program, Thomson Rivers University
“Climbing is high risk. But for me, there are intrinsic rewards in this risk—an ability to fill the desire for adventure, which we have 7-Elevened out of our life” - Conrad Anker
IntroductionIt is generally accepted that a certain amount of risk is an inherent part of any adventure (March, 1998). Indeed, some have argued that without risk there can be no adventure. Given that hazards are an ever-present and unavoidable component of any outdoor pursuit, the ability to identify, assess and manage the risk associated with these hazards is a critical skill for outdoor leaders. Hazards associated with outdoor pursuits have been split into two basic categories: objective and subjective (March, 1998). Objective hazards are those associated with the natural environment over which humans have little control. Examples include darkness, storms, avalanche, rockfall, weather, etc. Subjective hazards are the less obvious psychomotor, cognitive and affective hazards associated with the group including factors such as technical skill, judgement, physical fitness, emotional state and group dynamics (March, 1998). The ability to recognize, avoid and minimize exposure to objective hazards is, of course, an expected characteristic of an experienced outdoor leader. The most successful leaders, however, are the ones who have a thorough understanding of not only objective hazards but also subjective hazards that might be equally as destructive to the group’s objectives. An interesting phenomenon that has been observed in a group setting is the “risky shift.” Although it is difficult to obtain precise statistics, it is likely that this phenomenon is at least partly responsible for many accidents and fatalities in the outdoors every year and therefore it is important for outdoor leaders to understand its causes and ramifications. The purpose of this paper will be to examine this risky shift phenomenon. First, the phenomenon will be described and theories that have been postulated as to why it occurs will be examined. Then the implications for outdoor leaders and recreationists will be discussed, with emphasis on some practical issues that may help leaders and groups to recognize the potential for a risky shift and manage the problem, should it occur. What is the “Risky Shift”?
This phenomenon was first discovered as part of a master’s thesis by Stoner in 1961 and refers to the tendency for decisions made in groups to be less conservative than the decision of the average group member (Shaw, 1976). The results were initially met with surprise in the scientific community as they contradicted some prevailing theories of the time, most notably the “normalization theory” which stated that group decisions would reflect an average of opinions and norms. The 1960’s saw a flurry of research interest in the area and it was indeed confirmed that group risky shifts occurred. The shift was demonstrated in countries around the world and with many kinds of group participants (Forsyth, 1990). The risky shift is actually a form of “group polarization” - the tendency of group members to decide on a more extreme course of action than would be suggested by the average of their individual judgments. Interestingly, this polarization is not always towards the risky end of the spectrum – cautious shifts have also been found, though less frequently (Forsyth, 1990). A more accurate description of the situation is given by the group polarization hypothesis (Myers & Lamm, 1976) which states that “the average post-group response will tend to be more extreme in the same direction as the average of the pre-group responses” [italics added by current author]. Therefore, when the average choice of the group members before discussion is closer to the cautious pole of the continuum than the risky pole, a cautious shift may occur. Of course, by very definition, adventurous risk-taking individuals are far more likely to experience the shift in the risky direction. A further point is worth mentioning. It has been found that a critical element in producing group polarization is discussion (Forsyth, 1990). It has been demonstrated that discussion, with or without consensus, produces polarization; however consensus without discussion yields an averaging effect (Forsyth, 1990). This has important implications for outdoor leaders and will be elaborated upon below. 
“Clients skiing untracked powder may be so deep in the throes of ecstasy that they fail to listen to directions.” Photo courtesy of Phil Johnston
What causes group polarization and risky shifts?
This is an important question for outdoor leaders to ponder. If there is good understanding of the cause of a risky shift, a group member/leader may be more likely to prevent it from occurring or to detect it when it does occur. Since the discovery of group polarization, group dynamicists have put forward a number of theories to attempt to explain why such shifts happen. These include illusory cultural norms, the diffusion-of responsibility theory, leadership theories, familiarization theory and value theories (Forsyth, 1990; Powter, 1998).
In the sphere of mountaineering, an example of an illusory cultural norm might be represented by an attitude of “we’re a team on the mountain, therefore we’ll live” (Powter, 1998). Humans are innately social beings and tend to feel more comfortable being part of a social group, a phenomenon known as the herding instinct (Tremper, 2001). This instinct may have served us well during evolution but it can be deadly in the mountains, especially in avalanche terrain. Another common perception trap that could be classed as an illusory norm is to bring our human culture into a non-human setting, in essence a form of cultural arrogance. As Tremper (2001) points out, “city thinking and mountain thinking are very different things... when we go into the mountains, [city skills], more often than not, are liabilities”. Most humans are culturally insensitive to the backcountry, unable to speak its language and unwilling to accept its culture. Every year humans suffer the consequences of such an attitude and many pay for it with their lives.
The diffusion-of-responsibility theory states that group members will be more likely to recommend a risky course of action because of the feeling that they have less personal responsibility for the negative consequences of such a decision within the group setting (Forsyth, 1990). Stated another way, it is easier for an individual to hide within the group when making contributions to group decisions – they can take greater chances because they feel they are less likely to be blamed. A few investigators have cast doubt on this theory though.
Leadership theories revolve around the notion that high risktakers tend to exercise more influence over group members due to their greater persuasiveness, confidence, assertiveness and involvement in the discussion (Forsyth, 1990). This theory may carry some weight but is undoubtedly an oversimplification. If an individual demonstrates excessive amounts of these qualities, his credibility will almost certainly be undermined. Several researchers have been unable to demonstrate that this leadership effect occurs.
The familiarization theory asserts that as individuals mull over problems with others, they become more familiar with the items; as familiarity increases, uncertainty decreases, creating a willingness to advocate more risky alternatives. This theory appears to tie in nicely with the point made above that group discussion is a critical element in producing a risky shift. This theory would also imply that individuals who are allowed to familiarize themselves with an issue while alone should demonstrate a risky shift but this has not been consistently found. Therefore, similar to the above theories, some doubt has been shed on whether this is a valid theory.
The most widely accepted theories to explain the cause of a risky shift revolve around the notion that risk taking is a cultural value in itself. The general idea is that people in our society value risk, and in the group situation most individuals want to appear to be willing to take greater risks than the average person in order to be able to enhance their status in the group. Group discussion is essential as it allows the individual to learn his relative standing in the group as a risk-taker. Studies have clearly shown that most people regard themselves as above average risk-takers (of course a statistical impossibility) and tend to exhibit feelings of admiration for others who are perceived as being greater risk-takers than themselves (Forsyth, 1990). These findings provide clear evidence that the underlying assumption of the value hypothesis is correct.
Group dynamicists have developed two schools of thought within this general approach (Forsyth, 1990). The “social-comparison” theory argues that group members are trying to accomplish two interrelated goals during discussions. First, they are attempting to evaluate the accuracy of their own position on the issue by comparing it with others and, second, they are trying to make a favourable impression with the group. The result is a tendency to describe one’s own position in more extreme terms. The “persuasive arguments” theory, in contrast, stresses the information obtained during discussion and asserts that if the individual is exposed to a persuasive argument, they are more likely to shift or move their own decision in that direction. Both of these theories have been supported by researchers and this has prompted several investigators to suggest
that the two processes combine to produce polarization.
Implications of the risky shift and practical issues for outdoor leaders
A key question to be addressed in this section is in what kinds of situations is a risky shift most likely to occur? Armed with this information, prevention, detection and/or management of the phenomenon becomes substantially easier. The answer will unfortunately never be clear-cut, as the operation of any group, even the smallest, is a complicated union of many factors. Powter (1998) discussed group dynamics in a number of common wilderness experience situations: the guided trip, the growth/challenge experience, the personal recreation experience and the expedition.
The guided trip has probably the simplest and clearest norms for the group concerned, ones that are common knowledge; the guide makes the decisions in virtually all situations and client involvement is a matter of the guide’s discretion. Democracy in this instance would defeat the client’s intent in hiring a guide - to be provided with a controlled experience. As there is, in theory, little discussion between guide and client about precise details of the guided experience, there should be little opportunity for a risky shift to emerge. Of course, there may be situations where a group might conceivably place some pressure on a guide to attempt to change or modify a decision, but the guide always has the final say in decision making and most guided clients will respect this fact.
The growth/challenge experience, such as those offered by Outward Bound, uses the wilderness as a classroom for both skills and self-learning (Powter, 1998). The experiential learning model used necessitates a certain degree of democratic empowerment of the student which increases the possibility of a risky shift. However, the leader/instructor makes the autocratic decision as to the level to which the students will be empowered to make decisions and exercise control. Therefore, similar to a guided trip situation, excessively risky decisions will likely not
be implemented.
The personal recreation experience is a classic situation where leadership issues and group process norms are often not clearly defined. The situation can be very confusing for group members and emergent leaders, particularly if active and open communication is lacking. It can be democracy in its truest form – the “free-for-all” – but unfortunately this kind of scenario is precisely the one where the risky shift has the greatest chance of surfacing. Characteristics of group members that might further increase the chance of a risky shift occurring will be discussed further below.
The expedition is a situation where group dynamics become exponentially more complicated. As individuals have usually invested substantial time and money into such an experience, they have more to gain and more to lose and will be far more likely to fight for themselves. A paradox operates here: people on expeditions are usually strong independent individuals who often struggle with authority, but once on the expedition they are essentially in a controlled situation. Hardly surprisingly, tension often ensues and decisions may be clouded by this fact. The expedition leader is in a very delicate situation and must be sensitive to environmental and intra-group factors and prepared to be somewhat flexible with his/her leadership and decision-making style, depending on the situation. One could argue that risky shifts are more likely to occur on expeditions as individuals are often prepared to take greater risks to achieve their goals/dreams. However, this would be pure conjecture as there are a multitude of factors involved that are in a high state of flux.
It has been established, then, that the personal recreation trip, and the corresponding democratic decision-making process that tends to accompany it, is prime breeding ground for a risky shift. What are some further group characteristics within this situation that might influence the emergence of excessively risky decisions? Some factors that may come into play include size of the group, gender, age, personality, skill ability, cultural origin and mood of the group members.
Though little information could be found in the literature about the affect of group size on a risky shift, the topic deserves some attention. If one accepts some of the theories presented above regarding the possible causes of group polarization, it would seem reasonable to speculate that risky shifts may be more likely to happen in larger groups than smaller groups. Imagine a scenario where a small group of two individuals are deciding whether to ski a questionable snow slope versus the same situation but with a group of six individuals. Humans tend to feel safer when in larger groups and also there is a greater chance that someone in a larger group may have a more extreme view that might influence the group’s decision. Intuitively, one might deduce that there is a greater chance of a risky shift with more group members. It is unlikely, however, that the chances of group polarization will continue to increase with increasing group size. Presumably, a point will be reached where the democratic decision-making process will be “bogged down” by the increasing numbers involved. The affect of group size on the emergence of a risky shift in the outdoor setting would be an interesting area for future research.
There are vast amounts of scientific research that suggest that males are greater risk-takers than females (Wilde, 1994), a trait that likely has both physiological (hormonal) and social roots. Numerous accident statistics support this assertion. For example, in the period 1984-1996 in Canada, 90% of avalanche fatalities were male (Jamieson & Geldsetzer, 1996). In addition, the age category with the greatest fatalities was 20-29 (just under 30%). This agrees with research that has consistently shown that young individuals show greater proclivity for risk than later years. Therefore, it appears that young males may be particularly susceptible to a risky shift. Undoubtedly, there is truth to the statement, “Know the male yet keep to the female”! (Lao-tsu). Tremper (2001) states that, “I like to go into the mountains with women. I feel like I’m safer when I do. When I am out with my male friends, I know that I have to keep a sharp eye out for competition, pride and all the other traits that tend to go along with groups of men, because I’m often the worst of the bunch.”
Risk-takers also tend to be more competitive, aggressive, type A personalities than non risk takers (Begum & Ahmed, 1986) – “sensation seekers” as they are often called. A further finding that has emerged from avalanche accident statistics is that victims are often skilled in the activity (skiing, snowboarding, snowmobiling, etc) during which they suffered the accident (Tremper, 2001). It is likely that overconfidence in one’s skills “spills over” into one’s decision making regarding hazard and terrain assessment.
Some interesting findings have emerged regarding cultural origin and risk taking. It appears that male Caucasians of western origin are amongst the most “risk prone” individuals. Hong (1978), in a comparison of Chinese and American students, found that cautious shifts were far more likely in the former and risky shifts were far more likely in the latter. As discussed above, this is likely related to the value that risk carries in the Western culture as opposed to Asian cultures.
Finally, the influence of mood on group decision making and risky shifts is of importance and must be recognized. Heli-skiing guides are very aware of the euphoria phenomenon – clients skiing untracked powder may be so deep in the throes of ecstasy that they fail to listen to directions. Also, it is known that most avalanche accidents occur on the sunny days following a large snowfall when people are likely too busy enjoying themselves to pay attention to the hazards around them (Tremper, 2001).
“Summit fever” is another example – becoming fixated upon a goal at the expense of sound decision making. Negative moods, however, may also cause risky shifts. Take the scenario of a group of hungry, cold and wet hikers in foul weather who want to get home at the end of the day. The tendency will be for the group to rush decisions and cut corners which could have serious consequences. Just when they most need to pay attention, the weather and their mental state has pushed them to do the opposite.
Summary & Conclusions
Most outdoor enthusiasts and hopefully all outdoor leaders understand the importance of respecting objective hazards in the backcountry. There appears to be less appreciation for some of the more subtle subjective hazards associated with group members and group dynamics, yet these are no less important to understand. The risky shift is an example of such a hazard.
In the outdoor setting, risky shifts are most likely to occur on a personal recreation trip where the group members consist of young, competitive and enthusiastic Caucasian males who perceive that they are highly skilled in the activity in which they are engaged. The risky shift is one of many cognitive factors that can contribute to poor safety decisions in the outdoors, including lack of experience, inappropriate attributions, inattentiveness, “smelling the barn” and simply poor judgment (Priest & Gass, 1997). The importance of active and open communication amongst group members as a form of hazard avoidance cannot be underemphasized. If excellent communication combined with a deeper understanding of subjective hazards were a major priority for all groups involved in outdoor pursuits, there would undoubtedly be less accidents and fatalities annually in the wilderness.
References:
Begum, H.A. & Ahmed, E. (1986). Individual risk taking and risky shift as a function of cooperation-competition proneness of subjects. Psychological Studies, 31: 21-25.
Forsyth, D.R. (1990). Group Dynamics (2nd Edition). Pacific Grove, CA; Brooks/Cole Publishing.
Hong, L.K. (1978). Risky shift and cautious shift: some direct evidence on the culture-value theory. Social Psychology, 41: 342-346.
Jamieson, B. & Geldsetzer, T. (1996). Avalanche Accidents in Canada. National Research Council of Canada: Canadian Avalanche Association.
March, B. (1998). Adventure and risk. In: Toft, M (Ed). Playing it Safe – Selected Mountain Leadership Papers, Techniques and Test Reports of the Alpine Club of Canada. p.7-11. Calgary, AB: McAra Printing.
Myers, D.G. & Lamm, H. (1976). The group polarization phenomenon. Psychological Bulletin, 83: 602-627.
Powter, G. (1998). Group dynamics from a leadership perspective. In: Toft, M (Ed). Playing it Safe – Selected Mountain Leadership Papers, Techniques and Test Reports of the Alpine Club of Canada. p.29-43. Calgary, AB: McAra Printing.
Priest, S. & Gass, M.A. (1997). Effective Leadership in Adventure Programming. Champaign, IL: Human Kinetics.
Shaw, M.E. (1976). Group Dynamics: The Psychology of Small Group Behaviour. New York: McGraw-Hill.
Tremper, B. (2001). Staying Alive in Avalanche Terrain. Seattle, WA; The Mountaineers.
Wilde, G.J.S. (1994). Target Risk. [On-line]. http://psyc.queensu.ca/target/index.html
Tags:
risk management
risky shift
tony webster
Permalink
| Comments (0)
|
|
|
Posted By Alex Cooper, Canadian Avalanche Association,
August 19, 2020
|
From volume 92, spring 2010
By Kisa Elmer and Cora Shea
For those of you who have ever stopped to peer down at a single surface hoar crystal, the beauty of self assembly has already been revealed to you. The ability of water vapour to self-assemble into tiny ice sculptures still has scientists and curious observers searching for answers, and winter recreationists dodging avalanche trigger zones.
As avalanche safety workers reflect on the tragedies of past winters, surface hoar formation and the persistent weak layer that follows its burial appear to be poorly understood. So a research group like ASARC asks itself, what can we contribute to industries and recreationists? Two contributions are a better understanding of avalanche triggering mechanics and improved methods of identifying risk. One area of ongoing research is predicting and mapping surface hoar formation.
Surface hoar formation has been a difficult, yet essential research topic. Difficult because the natural processes behind crystal formation—such as wind and humidity—are near impossible to model at the scales relevant to surface hoar growth. Essential because, once buried, the surface hoar layer creates an ideal failure plane.
In the summer of 2009, the Applied Snow and Avalanche Research group at the University of Calgary hired a research assistant to help with the grunt work of research. That assistant was me, Kisa Elmer, a civil engineering student from the University of Saskatchewan. During the first month of my summer research position with ASARC, I worked with Cora Shea analyzing wide angle photos of the sky above surface hoar samples at the Fidelity study site in Glacier National Park. The objective was to understand the relationship between crystal size and sky view, a term defined as “the amount of open sky available for snow surface longwave radiation losses at night.” (Shea and Jamieson, 2009). This was my introduction to the curious subject of surface hoar formation. The next few weeks were full of lunch time discussions on the effects of temperature, wind, radiation and humidity on crystal growth.
After helping analyze the photos and comparing crystal sizes to sample locations, a new task presented itself. It had not been done before and neither Cora nor I knew if it would be successful. We were going to grow our own surface hoar in the cold lab—an unlikely place for surface hoar to grow. One reason is that the cold lab is closed off, which means that air flow and radiation losses are limited. A second reason is that there was no snow available for the crystals to grow on, so a proper surface needed to be found. 
Figure 1: Using basic equipment, the researchers worked to replicate a small sample of what nature does in incredible variety—make surface hoar.
The Experiment
On July 14, jumping head first into the experiment, we decided to do the intuitive thing; boil water, move it into the cold lab, trap it with a plastic container and simply let the natural phenomenon of self assembly take the reins. You can see the simple apparatus consisting of a pot of boiling water, a steel paint strainer, and two plastic paint strippers in Figure 1, all to be covered by a plastic bin. The apparatus was not sophisticated; there was no delicate thermocouple wires dedicated to providing temperature readings or expensive gadgets measuring relative humidity, yet, it was successful. After leaving it overnight in a dark cold lab, devoid of sky view and significant air flow, tiny ice sculptures appeared on the underside of the steel paint strainer.
At different temperatures there would be, inevitably, different formations occurring. Plates formed at an ambient cold lab temperature of -7 ºC (Figure 2), while needles and feathery structures formed at -12 ºC and -13 ºC (Figure 3). A transition zone producing stretched plate structures was also observed from -9 ºC to -11 ºC. To give you an idea of size, the plates measure on the scale of a few millimetres while the needles grew to a maximum of one centimetre.

Figure 2
Here’s how we thought it would work, in theory. The air trapped under the bin would soon become saturated and condense around the equipment. As the steel paint strainer cooled with its surroundings, the condensation began to freeze around its edges, creating a good base for surface hoar growth. However, this is not exactly what happened. There was an inconsistency in the temperature. Outside the bin was cold (sometimes down to -13ºC). Inside the bin the air was kept warm from the hot pot of boiling water. In the same way our body reacts to cold, the extremities of the experiment cooled first, and because the edges of the bin were the first to reach freezing temperatures, vapour molecules began moving away from our nicely laid out landing pad and towards the plastic bin. The unruly vapour collected itself onto the unintentional surface, forming a less interesting layer of frost.
While humidity is an important factor in the formation of surface hoar it is not the only cause of crystal growth. Wind and sky view are two other contributors to their growth. If humidity were the only factor, we would have seen a more uniformly spread collection of crystals. Instead, the crystal growth was concentrated near the openings between the paint strippers and the edge of the pot, growing towards the vapour source. By positioning the paint strippers in a way that constricted steam flow through the strainer (Figure 1), an environment offering saturated air flow was created.
Conclusion
The imitation hoar grew under different circumstances and through a different process than natural surface hoar crystals. Simply put, natural surface hoar is formed when the snow surface cools enough at night to attract nearby water vapour molecules from the air. The imitation surface hoar grew because of highly saturated air flow. Our questions about the relationship between sky view and crystal growth still remain, as new questions were generated on the underlying physical processes governing the phenomenon of self-assembly. Perhaps this small experiment created more questions than it answered.
Now, after wrapping up the project and heading back to university, I still think about how to improve the experiment for future trials. Maybe I can try different surface materials such as natural snow, a different set up, or a different procedure. What factors can be controlled and manipulated other than temperature and what will be the result? When starting the experiment I wasn’t sure whether any relevant results would be possible. Ice and frost were a given, but surface hoar? I wasn’t sure. After observing the outcome, I wonder if this is the beginnings of a new way to study surface hoar formation and what it might mean to practitioners in the future.
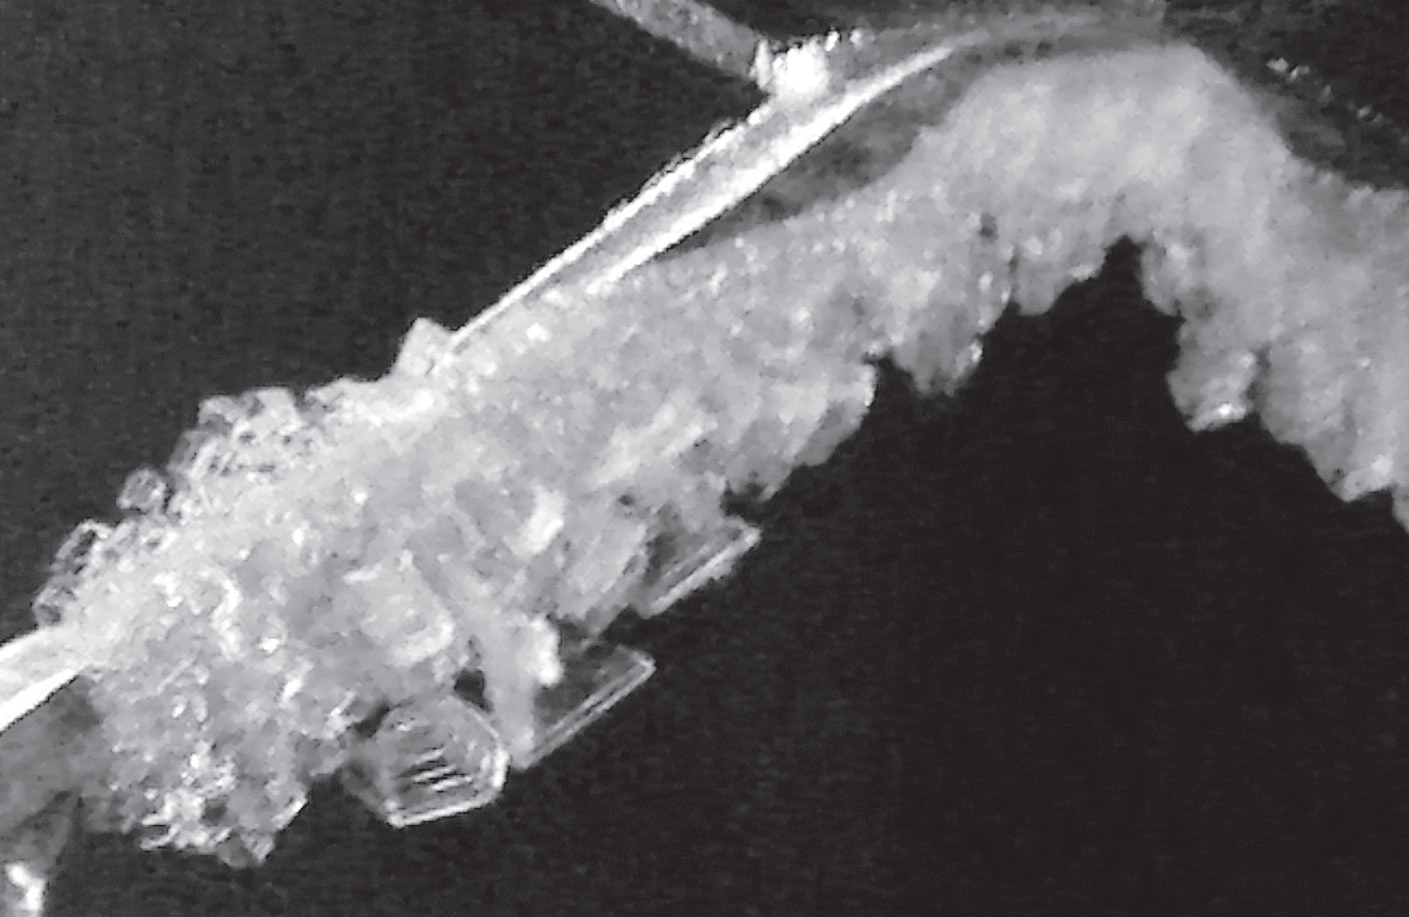
Figure 3
Acknowledgements:
Thanks to everyone involved, including all members of ASARC. Specifically, thanks to Cora Shea and Bruce Jamieson for all of their advice. Thank you to the Civil Engineering Department staff at Schulich School of Engineering who provided all the necessary equipment. I would not have been able to do this without the help of Terry Quin.
Reference:
Shea, C. and B. Jamieson. Predicting surface hoar spatial variability in sparse forests using shading in satellite imagery, International Snow Science Workshop, Swiss Federal Institute for Forest, Snow and Landscape Research WSL., Davos, Switzerland, p.102-106 (2009)
Tags:
applied snow and avalanche research centre
asarc
cora shea
kisa elmer
snow science
surface hoar
Permalink
| Comments (0)
|
|