  
|
Posted By Alex Cooper, Canadian Avalanche Association,
August 19, 2020
|
From volume 92, spring 2010
By Kisa Elmer and Cora Shea
For those of you who have ever stopped to peer down at a single surface hoar crystal, the beauty of self assembly has already been revealed to you. The ability of water vapour to self-assemble into tiny ice sculptures still has scientists and curious observers searching for answers, and winter recreationists dodging avalanche trigger zones.
As avalanche safety workers reflect on the tragedies of past winters, surface hoar formation and the persistent weak layer that follows its burial appear to be poorly understood. So a research group like ASARC asks itself, what can we contribute to industries and recreationists? Two contributions are a better understanding of avalanche triggering mechanics and improved methods of identifying risk. One area of ongoing research is predicting and mapping surface hoar formation.
Surface hoar formation has been a difficult, yet essential research topic. Difficult because the natural processes behind crystal formation—such as wind and humidity—are near impossible to model at the scales relevant to surface hoar growth. Essential because, once buried, the surface hoar layer creates an ideal failure plane.
In the summer of 2009, the Applied Snow and Avalanche Research group at the University of Calgary hired a research assistant to help with the grunt work of research. That assistant was me, Kisa Elmer, a civil engineering student from the University of Saskatchewan. During the first month of my summer research position with ASARC, I worked with Cora Shea analyzing wide angle photos of the sky above surface hoar samples at the Fidelity study site in Glacier National Park. The objective was to understand the relationship between crystal size and sky view, a term defined as “the amount of open sky available for snow surface longwave radiation losses at night.” (Shea and Jamieson, 2009). This was my introduction to the curious subject of surface hoar formation. The next few weeks were full of lunch time discussions on the effects of temperature, wind, radiation and humidity on crystal growth.
After helping analyze the photos and comparing crystal sizes to sample locations, a new task presented itself. It had not been done before and neither Cora nor I knew if it would be successful. We were going to grow our own surface hoar in the cold lab—an unlikely place for surface hoar to grow. One reason is that the cold lab is closed off, which means that air flow and radiation losses are limited. A second reason is that there was no snow available for the crystals to grow on, so a proper surface needed to be found. 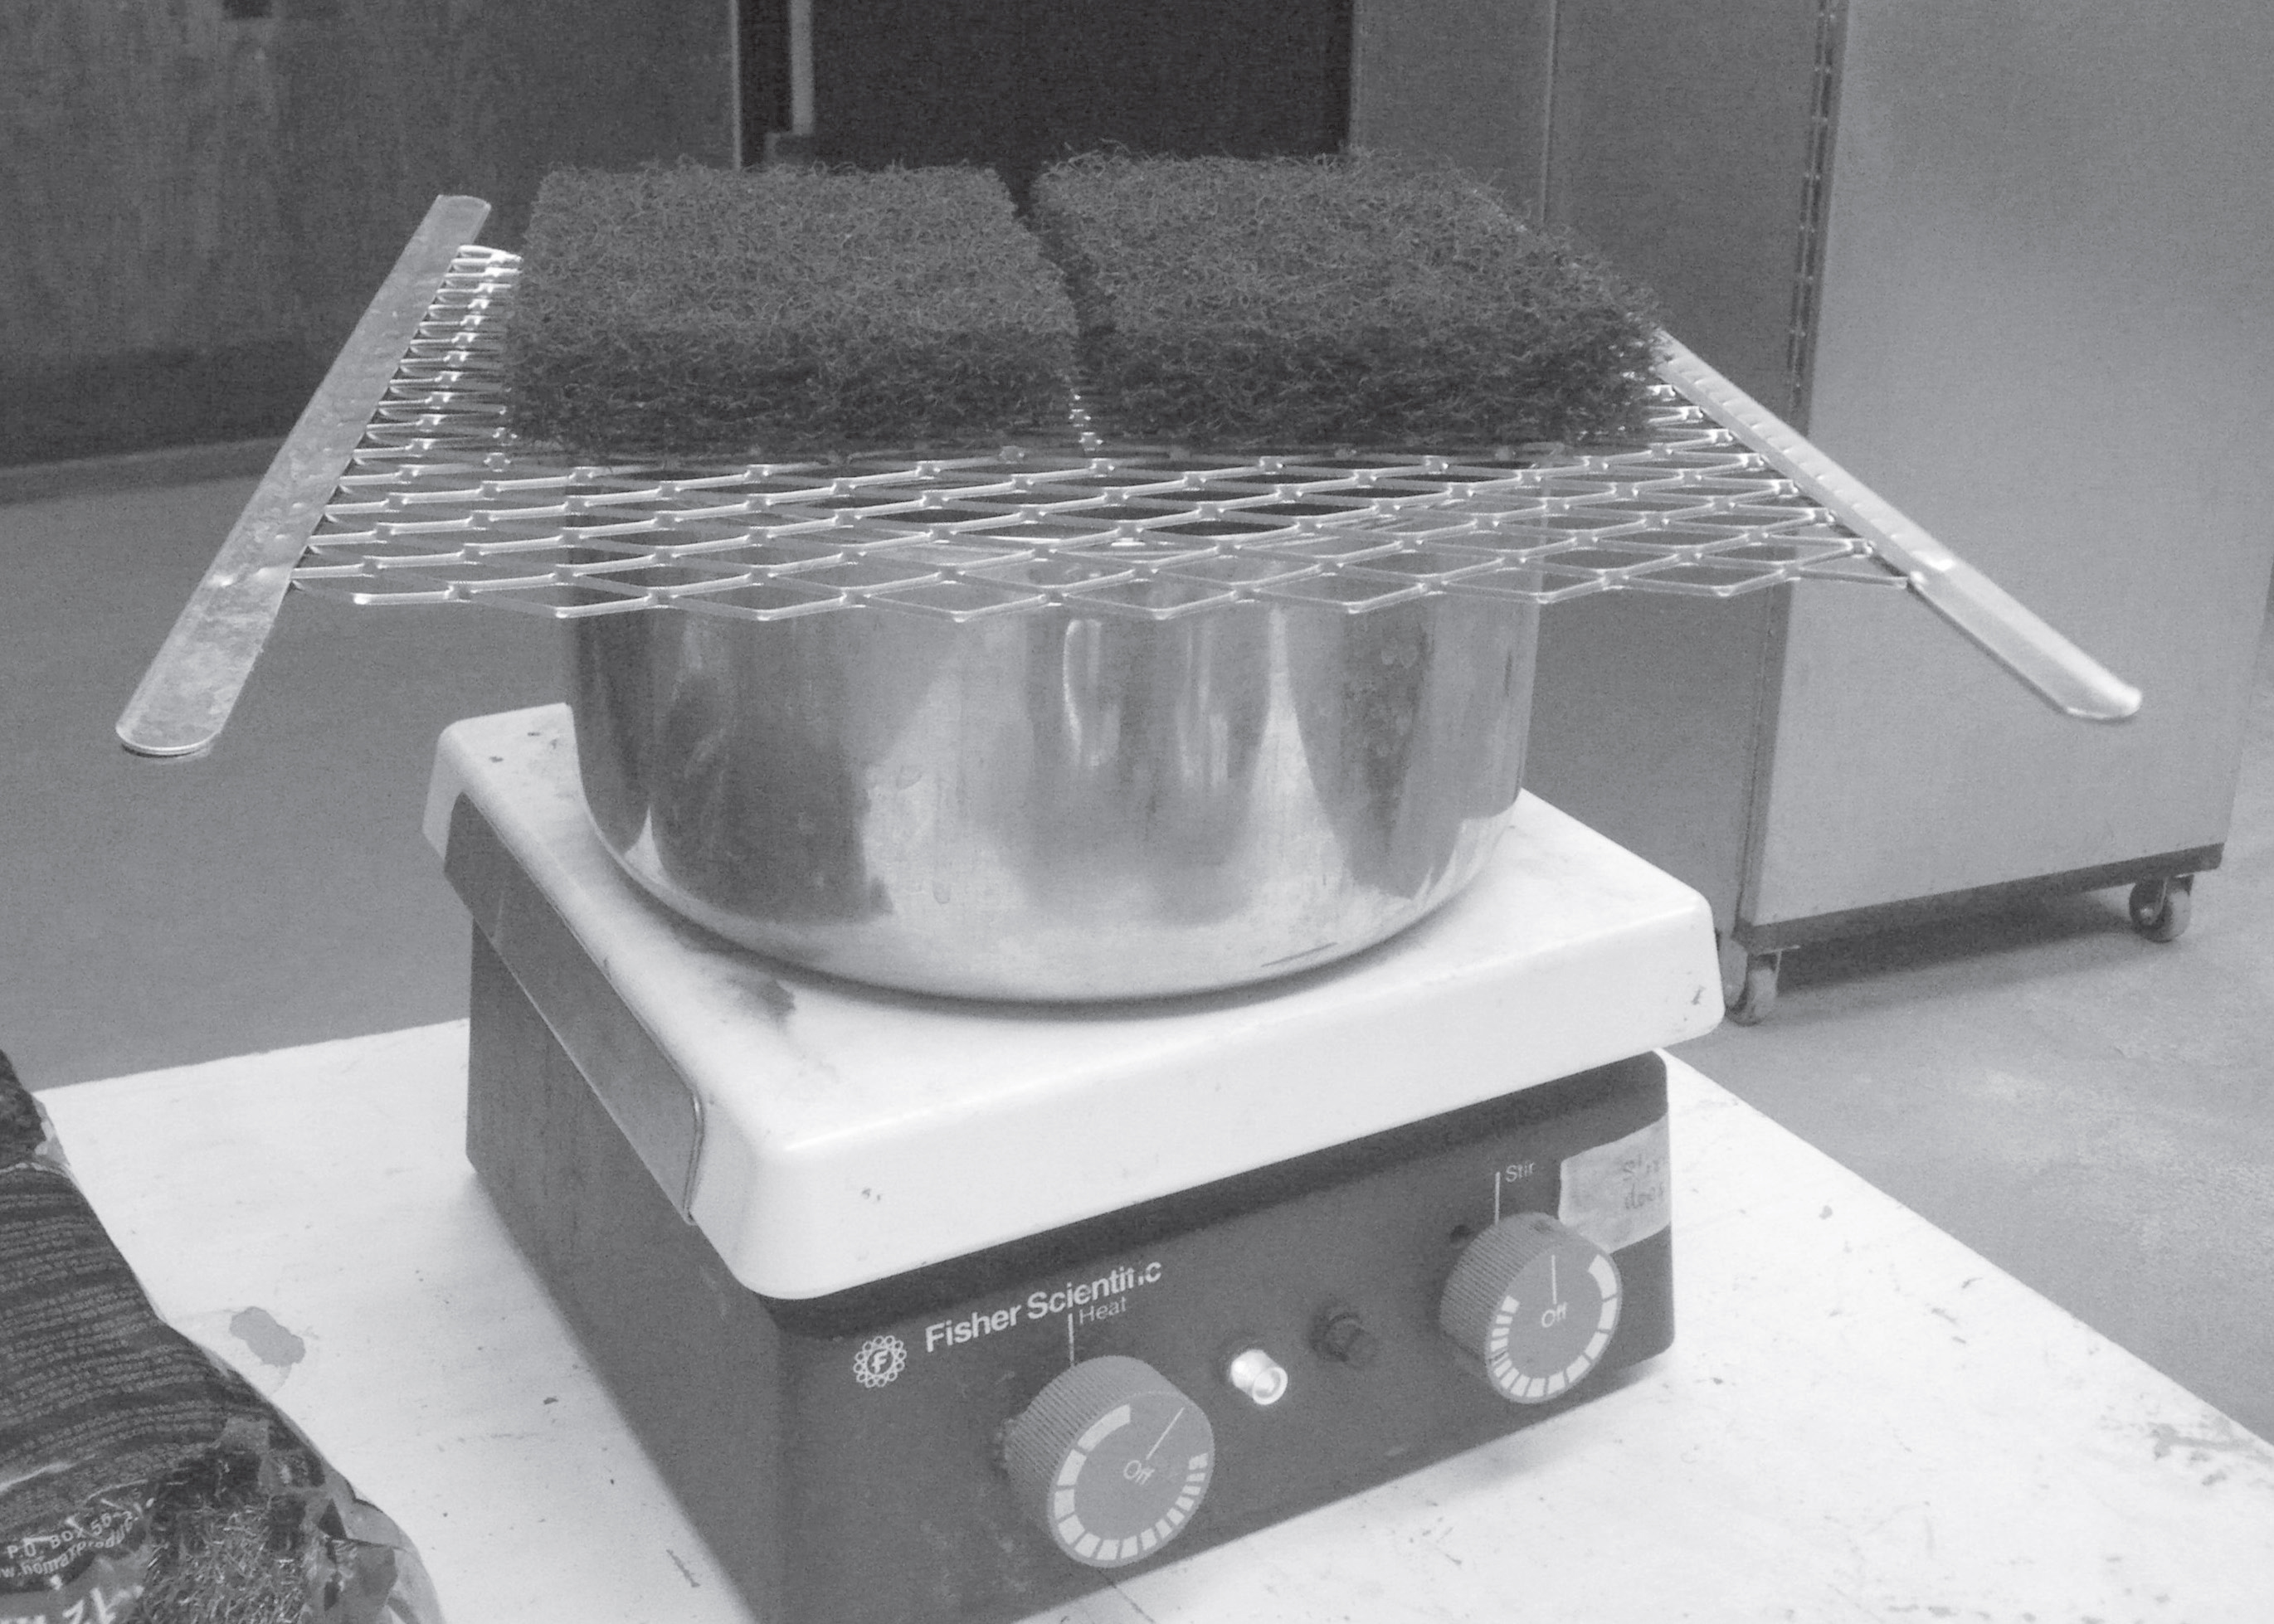
Figure 1: Using basic equipment, the researchers worked to replicate a small sample of what nature does in incredible variety—make surface hoar.
The Experiment
On July 14, jumping head first into the experiment, we decided to do the intuitive thing; boil water, move it into the cold lab, trap it with a plastic container and simply let the natural phenomenon of self assembly take the reins. You can see the simple apparatus consisting of a pot of boiling water, a steel paint strainer, and two plastic paint strippers in Figure 1, all to be covered by a plastic bin. The apparatus was not sophisticated; there was no delicate thermocouple wires dedicated to providing temperature readings or expensive gadgets measuring relative humidity, yet, it was successful. After leaving it overnight in a dark cold lab, devoid of sky view and significant air flow, tiny ice sculptures appeared on the underside of the steel paint strainer.
At different temperatures there would be, inevitably, different formations occurring. Plates formed at an ambient cold lab temperature of -7 ºC (Figure 2), while needles and feathery structures formed at -12 ºC and -13 ºC (Figure 3). A transition zone producing stretched plate structures was also observed from -9 ºC to -11 ºC. To give you an idea of size, the plates measure on the scale of a few millimetres while the needles grew to a maximum of one centimetre.

Figure 2
Here’s how we thought it would work, in theory. The air trapped under the bin would soon become saturated and condense around the equipment. As the steel paint strainer cooled with its surroundings, the condensation began to freeze around its edges, creating a good base for surface hoar growth. However, this is not exactly what happened. There was an inconsistency in the temperature. Outside the bin was cold (sometimes down to -13ºC). Inside the bin the air was kept warm from the hot pot of boiling water. In the same way our body reacts to cold, the extremities of the experiment cooled first, and because the edges of the bin were the first to reach freezing temperatures, vapour molecules began moving away from our nicely laid out landing pad and towards the plastic bin. The unruly vapour collected itself onto the unintentional surface, forming a less interesting layer of frost.
While humidity is an important factor in the formation of surface hoar it is not the only cause of crystal growth. Wind and sky view are two other contributors to their growth. If humidity were the only factor, we would have seen a more uniformly spread collection of crystals. Instead, the crystal growth was concentrated near the openings between the paint strippers and the edge of the pot, growing towards the vapour source. By positioning the paint strippers in a way that constricted steam flow through the strainer (Figure 1), an environment offering saturated air flow was created.
Conclusion
The imitation hoar grew under different circumstances and through a different process than natural surface hoar crystals. Simply put, natural surface hoar is formed when the snow surface cools enough at night to attract nearby water vapour molecules from the air. The imitation surface hoar grew because of highly saturated air flow. Our questions about the relationship between sky view and crystal growth still remain, as new questions were generated on the underlying physical processes governing the phenomenon of self-assembly. Perhaps this small experiment created more questions than it answered.
Now, after wrapping up the project and heading back to university, I still think about how to improve the experiment for future trials. Maybe I can try different surface materials such as natural snow, a different set up, or a different procedure. What factors can be controlled and manipulated other than temperature and what will be the result? When starting the experiment I wasn’t sure whether any relevant results would be possible. Ice and frost were a given, but surface hoar? I wasn’t sure. After observing the outcome, I wonder if this is the beginnings of a new way to study surface hoar formation and what it might mean to practitioners in the future.
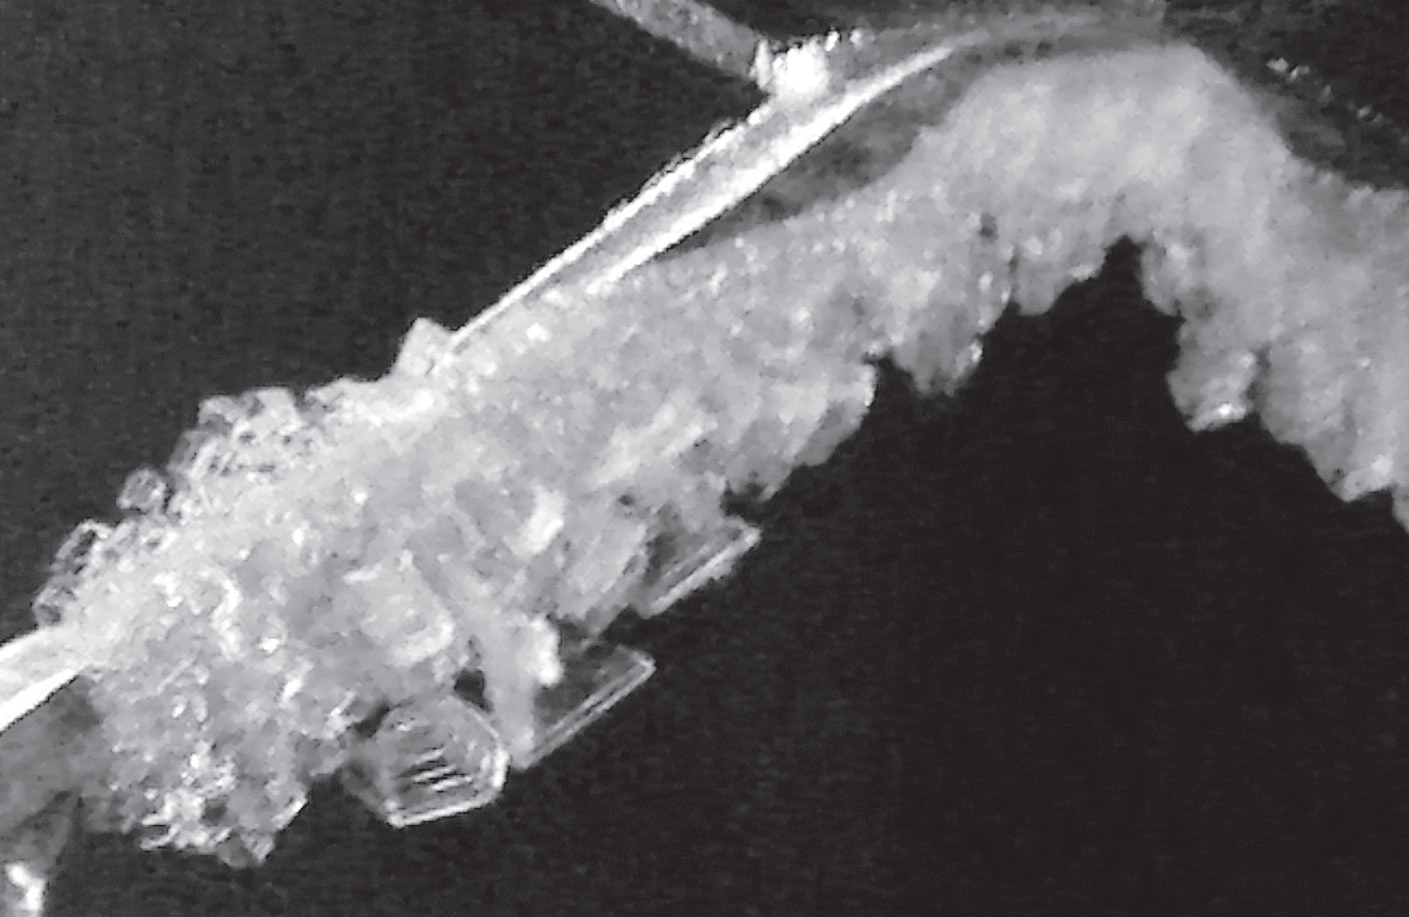
Figure 3
Acknowledgements:
Thanks to everyone involved, including all members of ASARC. Specifically, thanks to Cora Shea and Bruce Jamieson for all of their advice. Thank you to the Civil Engineering Department staff at Schulich School of Engineering who provided all the necessary equipment. I would not have been able to do this without the help of Terry Quin.
Reference:
Shea, C. and B. Jamieson. Predicting surface hoar spatial variability in sparse forests using shading in satellite imagery, International Snow Science Workshop, Swiss Federal Institute for Forest, Snow and Landscape Research WSL., Davos, Switzerland, p.102-106 (2009)
Tags:
applied snow and avalanche research centre
asarc
cora shea
kisa elmer
snow science
surface hoar
Permalink
| Comments (0)
|
|
|
Posted By Alex Cooper, Canadian Avalanche Association,
February 12, 2020
|
From volume 86, fall 2008
By James Floyer

INTRODUCTION
High resolution penetrometer technology has been around for a while now. The first analogue instrument was made in the 1970’s (Bradley’s resistograph) and a digital version was made a decade later (Dowd and Brown’s digital resistograph). Over the years a handful of instruments have appeared, hoping to lure practitioners into plunging probes into the snow and wean them off the laborious habit of digging pits. Although there still seems to be a lot of enthusiasm surrounding penetrometer technology, in practice the luring and the weaning just hasn’t happened yet.
While these fancy instruments have excited researchers with their ability to objectively and rapidly measure snowpack properties (most that have been produced measure hardness, some measure density), there are some good reasons why snowpack penetrometers have not found their way into everyday, mainstream snow assessment practices. One reason is cost. Personally, I don’t put too much store on this, as I firmly believe that people would be willing to pay quite a bit of money for an instrument if it made the task of assessing snowpack stability faster and/or more certain. Instead, I believe the more important reason is that we haven’t yet figured out how to reliably identify weak layers of interest (critical weak layers) from the penetrometer signals.
The study summarized here (see Floyer (2008, pp. 129-151) for a more detailed account) makes a step towards the goal of detecting critical weak layers by relating the shape of the penetrometer signal at a weak layer to the fracture character of that weak layer determined from a nearby compression test. Using the premise that weak layers that fall into the sudden fracture character category can be considered of critical interest, a scheme is presented that allows for this discrimination to be made. The scheme does require the weak layer to be pre-identified, so essentially this scheme is a method for determining the importance of a weak layer that has already been defined. At the University of Calgary, we have also been making progress towards weak layer detection, but for now, I’ll focus on the fracture character study.
METHOD
The penetrometer profiles for this study were collected using a modified SABRE penetrometer (Mackenzie and Payten, 2002) manufactured by Himachal Safety Systems. This manually driven instrument records force-resistance with depth at a frequency of 1000 Hz. The analytical techniques used here could readily be applied to data collected using other digital force-resistance penetrometers.
Compression tests were carried out in close proximity to the penetrometer profiles and the fracture character and depth of each fracture was recorded. In total, 78 penetrometer profiles and 56 compression test results were collected from 28 different site-days and 16 unique sites during the winter of 2007-2008. A typical test configuration is shown in Figure 1.
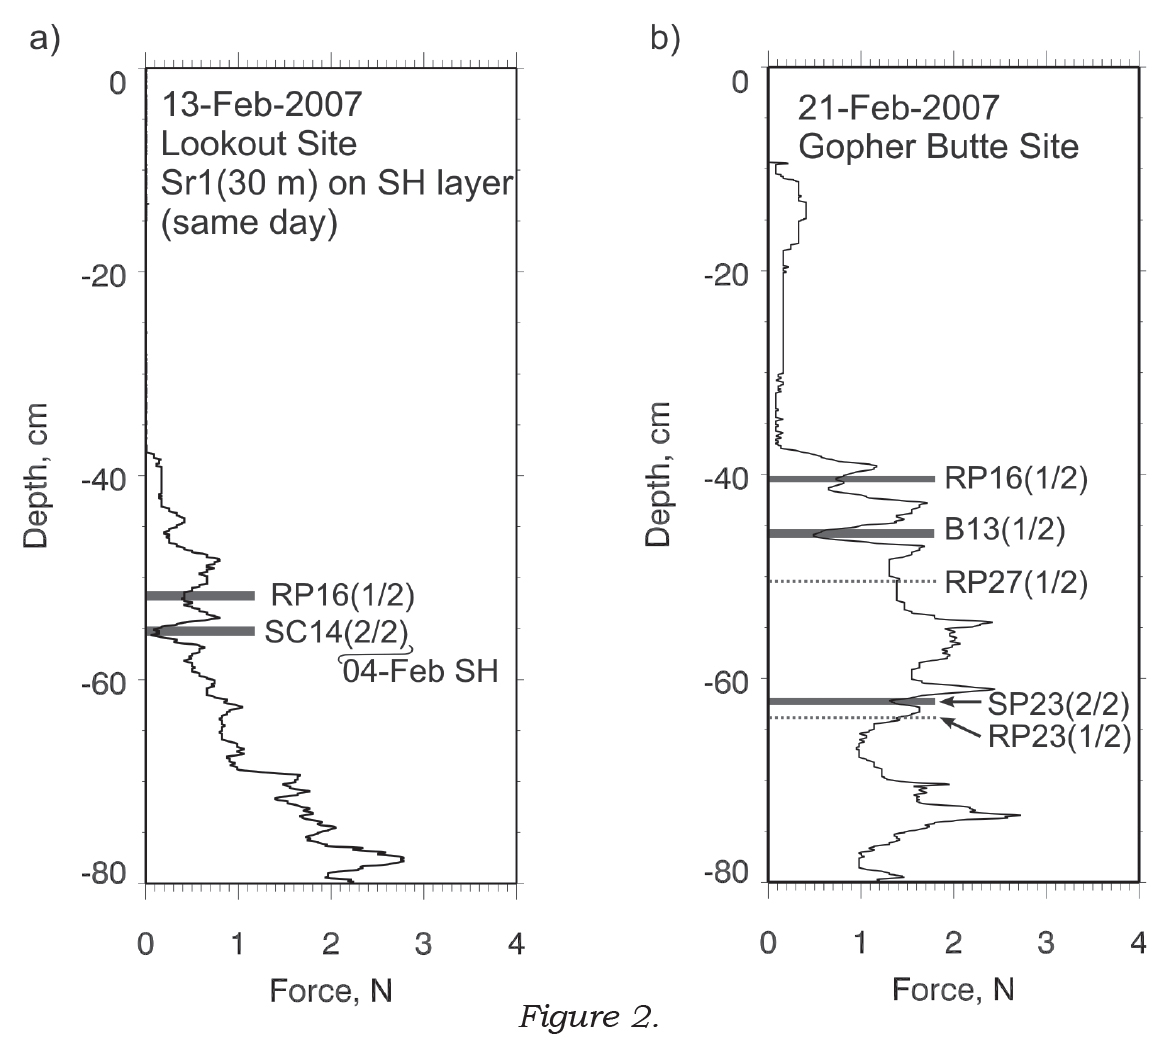
From the penetrometer profiles, weak layers (with thickness) or interfaces (with no thickness) were manually identified in the penetrometer signals using the depth information from the compression test results. Due to inaccuracies in the depth information associated with both penetrometer and compression test measurements, the weak layer/interface was interpreted in the penetrometer signal up to ±2 cm from the depth recorded in the compression test. Two examples of interpreted penetrometer pushes are shown in Figure 2. Fractures in very low resistance snow could not be identified, due to the SABRE penetrometer’s inability to measure fist resistance snow.
In total, 83 weak layers/interfaces (hereafter referred to as weak layers) were identified in the penetrometer signals. Of these, 41 were resistant planar fractures, 20 were sudden collapse, 14 were non-planar breaks, seven were sudden planar, and 1 was a progressive compression. Due to the low numbers of sudden planar and progressive compression fractures, it was decided to combine the classes into sudden fractures (sudden collapse and sudden planar) and others (resistant planar, non-planar breaks and progressive compression); this grouping reflects the higher incidence of skier-triggered avalanches associated with sudden fractures (van Herwijnen and Jamieson, 2007).
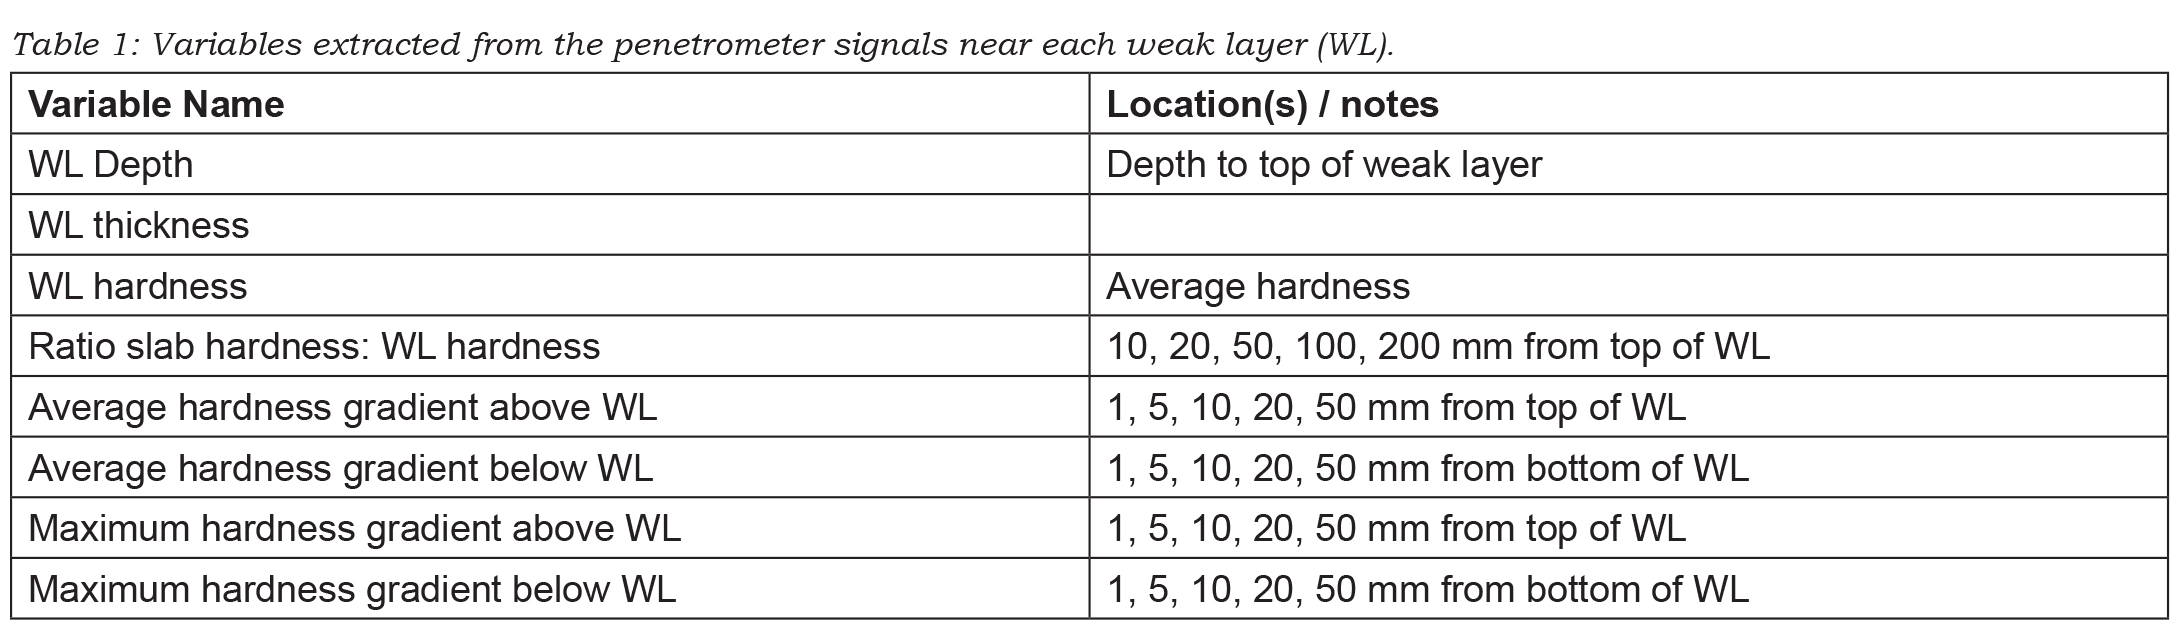
A number of variables were extracted from the penetrometer signals associated with and surrounding the interpreted weak layers. These variables are shown in Table 1. Some of the variables were tested at a number of different distances away from the top and bottom of the weak layer, since, for these variables, the optimum distance from the weak layer was unknown.
A univariate analysis was used to determine the variables that showed the greatest amount of difference in the signals associated with sudden and other groups of fractures. The best variables from the univariate analysis were selected for inclusion in a linear discriminant analysis. Discriminant analysis provides further information on the power of the variables to discriminate between the sudden and other groups, as well as giving a scheme for combining the variables and classifying the penetrometer signal into the sudden and other group.
RESULTS
The variables selected from the univariate analysis for inclusion in the discriminant analysis are shown in Table 2. The second column in this table shows the factor structure coefficients from the discriminant analysis, which gives a measure of the relative importance of each variable for discriminating between the sudden and other fracture character groups.
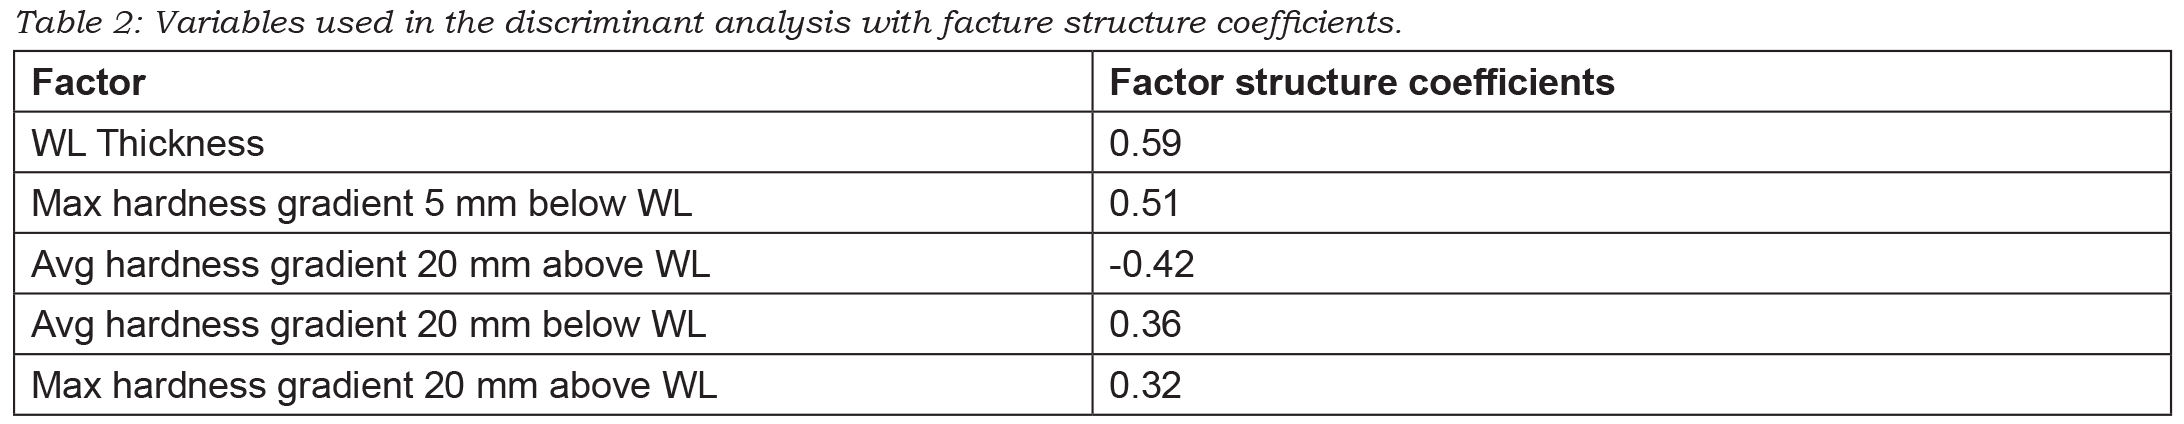
From the discriminant analysis results, weak layer thickness contributes the most to group separation, with thick layers selecting for sudden fractures. This has an intuitive explanation that thick weak layers are associated with sudden collapse fractures, which, in this analysis, account for the bulk of the sudden fractures. The variable with the second greatest contribution to group discrimination, maybe surprisingly, is the maximum hardness gradient up to 5 mm below the weak layer. For this variable, the absolute value for the maximum was used, so the positive value means that a greater maximum hardness gradient selects for sudden fractures. The average hardness gradient 20 mm below the weak layer also contributes to discrimination, although to a lesser extent. These two variables combined indicate that a stiffer substratum may favour sudden fractures.
Both the average gradient and the maximum gradient 20 mm above the weak layer also contribute to group separation, with factor loadings of -0.42 and 0.32 respectively. The negative value for the average gradient is associated with the negative average gradient values above the weak layer (generally a decrease in hardness with an increase in depth); so a higher negative value still indicates that higher values are associated with sudden fractures. These variables relate to the generally accepted view that a stiffer layer of snow above the weak layer is important for fracture propagation (van Herwijnen and Jamieson, 2007).
The discriminant function built using standardised function weights (not shown, see Floyer (2008, p. 164)) was used to classify the weak layer/interfaces identified in the penetrometer signals into sudden or other fracture character groups. Using a leave-one-out cross-validation method, 77.8% of sudden fractures were correctly classified and 81.5% of other fractures were correctly classified. The overall prediction rate was 79.6%. Classification parity was good between the two groups.
SUMMARY
A method for predicting the broad fracture character group (sudden or other) from penetrometer signals has been developed, based on a multivariate statistical analysis of penetrometer signals interpreted against fracture character results from nearby compression tests. Using a leave-one-out cross-validation method, overall classification rates of approximately 80% were achieved. Weak layer thickness, maximum hardness gradient 5 mm below the weak layer and the average hardness gradient 20 mm above the weak layer contributed the most to discriminating between the two groups.
Results for the sudden category were likely biased towards sudden collapse fractures, which dominated the data set used in this study. More observations are necessary to be able to distinguish between sudden collapse and sudden planar fractures in the sudden category, as well as between the resistant planar, progressive compression and non planar break fractures within the other category. There are also concerns over the subjective nature of the penetrometer signal interpretation, although this was mitigated by setting limits on the window in which the weak layer could be identified.
These results are promising, since they indicate that weak layers may be classified on the basis of fairly simple parameters extracted from the penetrometer signal. If combined with layer detection methods and possibly micro-structural information from higher resolution penetrometers (such as the SnowMicroPen), we move closer to the possibility of automated critical weak layer detection from penetrometer signals.
ACKNOWLEDGMENTS
I would like to thank Bruce Jamieson, who supervised my degree at the University of Calgary. I would also like to thank the entire ASARC crew, the staff at a great number of operations in BC and AB, and the various financial supporters of the ASARC program.
REFERENCES
Floyer, J. A., 2008. Layer detection and snowpack stratigraphy characterisation from digital penetrometer signals, (Ph.D. thesis), Dept. of Geoscience, University of Calgary, Calgary, Canada.
van Herwijnen, A. and B. Jamieson, 2007. Fracture character in compression tests, Cold Regions Science and Technology, 47(1-2), 60–68.
Mackenzie, R. and W. Payten, 2002. A portable, variable-speed, penetrometer for snow pit evaluation, Proceedings of the International Snow Science Workshop (2002: Penticton, BC), 294–300.
Tags:
james floyer
penetrometer
snow profile
snow science
snowpack tests
Permalink
| Comments (0)
|
|
|
Posted By Alex Cooper, Canadian Avalanche Association,
January 8, 2020
|
From vol. 102, winter 2012-13
By Penny Goddard

TREBLE CONE SKI AREA, NEW ZEALAND. THIS BASIN WAS CLOSED DURING THE DAY DUE TO CREEP AND GLIDE CONCERNS. AT 17:00 THE SURFACE WAS STARTING TO REFREEZE, SO THE FORECASTER GAVE THE OK FOR GROOMER OPERATORS TO GO INTO THE BASIN TO WORK. THE AVALANCHE OCCURRED SOME TIME DURING THE NIGHT, FAILING ON DEPTH HOAR AT GROUND. IT DAMAGED THE LIFT BULL WHEEL. // DEAN STAPLES
Avalanches that occur during periods of cooling are important because they can surprise people. The subject first piqued my interest several years ago while watching the sun leave a steep slope on the opposite side of the valley from a ski lodge in New Zealand. When a large slab released from the slope minutes later, it seemed incongruous.
NO OBVIOUS TRIGGER was present: no recent loading by wind, snow or rain, no person and no bomb. The only change I perceived was a rapid drop in temperature as the slope moved from full sunshine to shade and into its associated early evening chill. Days later, the same thing happened on the same slope.
In 2005, I became an avalanche forecaster at Broken River Ski Club in New Zealand. Lingering in the shadows of my mind was an avalanche which had occurred there 13 years prior. The week preceding the avalanche had been stormy, with 142mm of precipitation. Fluctuating freezing levels eventually led to a rain-soaked snowpack. On the day of the avalanche, the weather cleared, temperatures dropped and the snow surface became slick and icy. Staff decided to open the area based on conventional wisdom: cooling and surface re-freezing promote stability.
At lunchtime, a size 4 avalanche failed near the ground on depth hoar, pulling out the entire Broken River basin with a crown up to 2.2m deep. It propagated 800m wide into low-angled terrain, leaving a deposit 20-30m deep. A snow groomer and skiers were in parts of the basin and may have been the trigger, but they were far from the fracture line. Amazingly, because almost all other skiers were inside having lunch only the ski area manager was killed.
A photo of the avalanche hung on the wall in the forecasting office, leaving me chilled and uncertain. Doesn’t an icy, frozen surface mean the snowpack’s locked up? Why did the avalanche fail then and not during the warm storm? Why did it propagate so widely?
So began my investigation. I turned to the books to read up on the phenomenon and learn about the mechanisms behind such events. Beyond some passing references to rapid temperature changes, the standard volley of avalanche reference books left me empty-handed. I tried scientific journals, asked academics and searched online. Very little came to light. So I began to ask my colleagues. A few people had experienced something like
it. Many hadn’t.
A more formal questionnaire followed. In the end, 40 avalanche professionals from around the world responded. The questionnaire focused specifically on ‘re-freeze’ type events (where the snow surface goes from 0°C to below 0°C). I called this a “Cool-Down Avalanche” (CDA). The responses alerted me to the prevalence of surprising, large avalanches during periods of rapid cooling, not just when the snow surface goes from melt to freeze, but also at overall lower temperatures (e.g. a drop from -5°C to -15°C).
This article firstly summarizes the results of the questionnaire, and then highlights a round of cooling-related avalanches in Western Canada during the 2010-11 winter season.

MISTAYA LODGE, WESTERN ROCKIES. OVERNIGHT, JAN. 17/18, 2011 AFTER A STORM WHICH DEPOSITED 1M+ SNOW HAD ENDED. THERE WAS OVERNIGHT AIR TEMPERATURE COOLING FROM -3°C TO -13°C AND WIND (HOWEVER, MANY OF THESE SLOPES WERE NOT LEE TO THE WIND). MORE THAN 20 AVALANCHES RELEASED, SIZE 1 TO 3.5 (MANY 2-2.5) WITH CROWNS 100-150CM, SOME UP TO 200CM DEEP. SEVERAL AVALANCHES WERE OBSERVED IN UNUSUAL LOCATIONS. // DAVE BIRNE
PART 1: THE RESULTS OF THE CDA QUESTIONNAIRE
- In order of descending quantity, observations came from New Zealand, North America, Europe, Asia and Antarctica.
- 15 of the 40 respondents had never experienced a CDA. Many more people elected not to answer the questionnaire at all, due to having never experienced a CDA.
- About 360 CDA were observed. This number is approximate, as the bulk of observations were poorly recorded, based instead on observers’ memories.
- 98% of observed CDA were described as slab avalanches, 2% as loose.
- The bulk of the observed avalanches were size 2-3; 14 were size 4 and three were size 5.
- 61% were described as ‘glide’ releases.
- 20 CDA events occurred within 15-60 minutes of the sun leaving the slope. A further seven occurred less than 15 minutes after the sun left the slope.
- 21% of respondents had experienced a close call involving a CDA. These included large avalanches hitting an open highway, burying a ski lift in an area open to staff, and fully burying people in guided groups.
- 38% of respondents factor CDA into their decision-making while managing the exposure of people and infrastructure to avalanches. 44% said they do not.
- Seven people who had never had a close call involving a CDA factor the possibility of CDA into their decision-making. Interestingly, three people do not factor CDAs into their decision-making, in spite of having had a close call involving a CDA (including involvement in fatal incidents).
The following comments made by respondents help address some of the reasons why CDAs are rarely factored into operational forecasting:
- “[This is] much too speculative a theory to apply in an operational forecast.”
- “I see 'cool-down' as the more stable end of the curve.”
- “I don't factor CDAs into management due to a lack of understanding and observations.”
- “I don't factor CDAs in, as it seems a very rare event.”
- “I don't factor CDAs in, as there’s no knowledge base, therefore they are hard to estimate.”
- “The funny thing is, I probably still guide and operate considering cooling down as a good tick for stability.”
CDA CONCLUSIONS
- CDAs (surface refreezing avalanches) were observed around the world.
- Accidents and near-misses have occurred when operators have re-opened previously closed terrain assuming that cooling means dramatically improved stability.
- Some operators actively manage the CDA hazard through closures or explosives control, which are timed to coincide with rapid cooling or surface refreezing.
- They were rarely observed overall–many experienced practitioners have never experienced a CDA.
- There is a feeling that they are too difficult to predict, so there is a tendency to ignore them when making decisions.

LANARK PATH, ROGERS PASS, 8:00, JAN. 18, 2011. THE AVALANCHE WAS SIZE 4.5 AND DAMAGED TEN ACRES OF FOREST. IT FAILED ON FACETS/CRUST AT GROUND. THE AIR TEMPERATURE DROPPED FROM -3°C TO -17°C OVERNIGHT PRIOR TO THE EVENT. IT FAILED AROUND THE TIME THAT SUN FIRST HIT THE SLOPE. // MINISTRY OF TRANSPORTATION AND INFRASTRUCTURE - AVALANCHE AND WEATHER PROGRAMS
PART 2: COOLING EVENTS IN WESTERN CANADA DURING WINTER 2010-11
It is important to distinguish a key difference between Part 1 and Part 2. The questionnaire in Part 1 asked specifically about ‘re-freeze’ CDA events (snow surface going from 0°C to below 0°C). The events listed in Part 2 occurred during periods of rapid cooling within an overall colder temperature regime and did not involve a clear melt-freeze process at the surface.
The included photos show a succession of large avalanches that occurred during periods of rapid cooling in western Canada. Operators described these events as very surprising, eye-opening, historic and unusual.
SOME COMMON FACTORS IN THE EVENTS OF 2010-11:
- Heavy storm loading occurred prior to the event.
- All but one failed on a persistent weak layer.
- Rapid air temperature cooling occurred, often around 7-10°C
overnight.
- They were mostly very large events with wide propagation.
- In every case, experienced locals were surprised by the
events.
CONCLUSION
What does all this mean? Is there anything more than a sense of vague paranoia to take away? It seems clear that avalanches sometimes occur during periods of rapid cooling, both when the snow surface is going from melt to freeze and at overall colder temperatures. It is unclear whether, or how, cooling itself triggers avalanches—and that is a topic for a whole different study.
What does seem apparent to me is that many near-misses and possibly some serious accidents were caused by faulty decision-making around cooling. The premise that cooling stabilizes the snowpack after a storm (or solar warming) ends is not always correct. Always basing decision making on this premise can lead to premature exposure to avalanche terrain.
The most constant element in these events was that of surprise. In many cases, professionals were just about to (or just had) opened up terrain previously off-limits for public, guests and staff access.
This research is mostly a collection of anecdotes. In order to really understand the mechanisms behind avalanches that occur during periods of cooling (and from there, to be able to forecast them), as a community we need to better document this type of event. I hope that this preliminary investigation will spark some discussion, spawn some more focussed research and perhaps encourage decision-makers to take a ‘second look’ at conditions during periods of rapid cooling.
I presented this topic at conferences in Penticton, and New Zealand last year. On both occasions, numerous audience members revealed that they, too, had experienced surprising avalanches during times of rapid cooling. My feeling is that this phenomenon, while sporadic, is more common than one might expect.

HILDA PEAK, VALKYR RANGE, JAN. 20, 2011. THIS SIZE 4 AVALANCHE WAS AN ISOLATED EVENT WHICH OCCURRED POST-COOLING. THERE WERE NO OTHER LARGE NATURAL AVALANCHES DURING THE CYCLE. IT DESTROYED MATURE FOREST. // RYAN GLASHEEN
ACKNOWLEDGEMENTS
Thanks to the following for their contribution: Bill Atkinson, Mark Austin-Cheval, Reid Bahnson, BC Ministry of Transportation – Avalanche and Weather Programs, Canadian Avalanche Centre, Peter Bilous, Dave Birnie, Stewart Blennerhassett, Kevin Boekholt, Jay Bristow, Wayne Carran, Howard Conway, Rosco Davies, Jef Desbecker, Thomas Exner, Ryan Glasheen, David Hamre, John Hooker, Andy Hoyle, Damian Jackson, Dan Kennedy, Karl Klassen, Mark Klassen, Brett Kobernik, Gary Kuehn, Chris Landry, John Mletschnig, Jane Morris, Shaun Norman, Tom O’Donnell, Christine Pielmeier, Tarn Pilkington, Nicholas Rapaich, Tim Robertson, Davie Robinson, Mike Rubenstein, Mark Sanderson, Mark Sedon, Ron Simenhois, Jim Spencer, Dean Staples, John Stimberis, Frank Techel, Craig Wilbour and Henry Worsp.
Tags:
penny goddard
post-cooling avalanches
snow science
Permalink
| Comments (0)
|
|