  
|
Posted By Administration,
September 16, 2020
|
From vol 123, Spring 2020
By Simon Horton
HOW TECHNOLOGY TRANSFORMED WEATHER FORECASTING, AND WHAT IT COULD DO TO AVALANCHE FORECASTING.

AVALANCHE CANADA FORECASTER GRANT HELGESON TESTS SOME PROTOTYPE FORECASTING TOOLS. // ALEX COOPER WEATHER FORECASTING HAS RADICALLY transformed over the past century. In the 1920s, field observers reported current weather conditions back to meteorologists, who would draw up weather maps and extrapolate the weather for the next few days. Fast forward 100 years and precise forecasts are possible in mountainous terrain thanks to a global network of earth observations, advances in scientific understanding, and some of the most powerful supercomputers in the world.
This raises the question, will avalanche forecasting head down a similar transition from field-based to computer-based work?
Certainly not anytime soon, but some form of technological progression is inevitable. The transition for weather forecasting took decades, starting around the time of the Second World War. Growth in aviation enhanced our interest in the atmosphere, that in turn changed our perspective of the weather. In the decades that followed, space exploration led to weather satellites that gave us an even broader view of the atmosphere. Then, early computers began crunching numbers to help with these extrapolations.
Despite these technologies, weather forecasting remained deeply rooted in experience-based pattern recognition for several more decades. By the 1970s, computer models began giving reasonable upper air forecasts (such as jet stream forecasts), but the Second World War-era style of human-centric forecasting still prevailed. the tides turned in the 1980s and 1990s when computer forecasts became more accurate and forecasters eventually learned when they
could and could not trust them. Trust in the ability of computer models to accurately predict weather continues to grow.
Avalanche forecasting currently relies on manual field observations and experience-based pattern recognition comparable to methods used by Second World War-era weather forecasters. However, over the past decades, the avalanche research community has developed remote sensing and computer modelling methods that have similar potential to observe, understand, and predict avalanche conditions. These technologies are at a similar status to weather forecasting technologies from the 1960s or 1970s. New methods are becoming available, but we don’t really know how to implement them into daily work.
As we saw in weather forecasting, these barriers were eventually overcome as the technology improved. We can speculate what a future avalanche forecasting system might look like by looking at how similar technology transformed weather prediction. 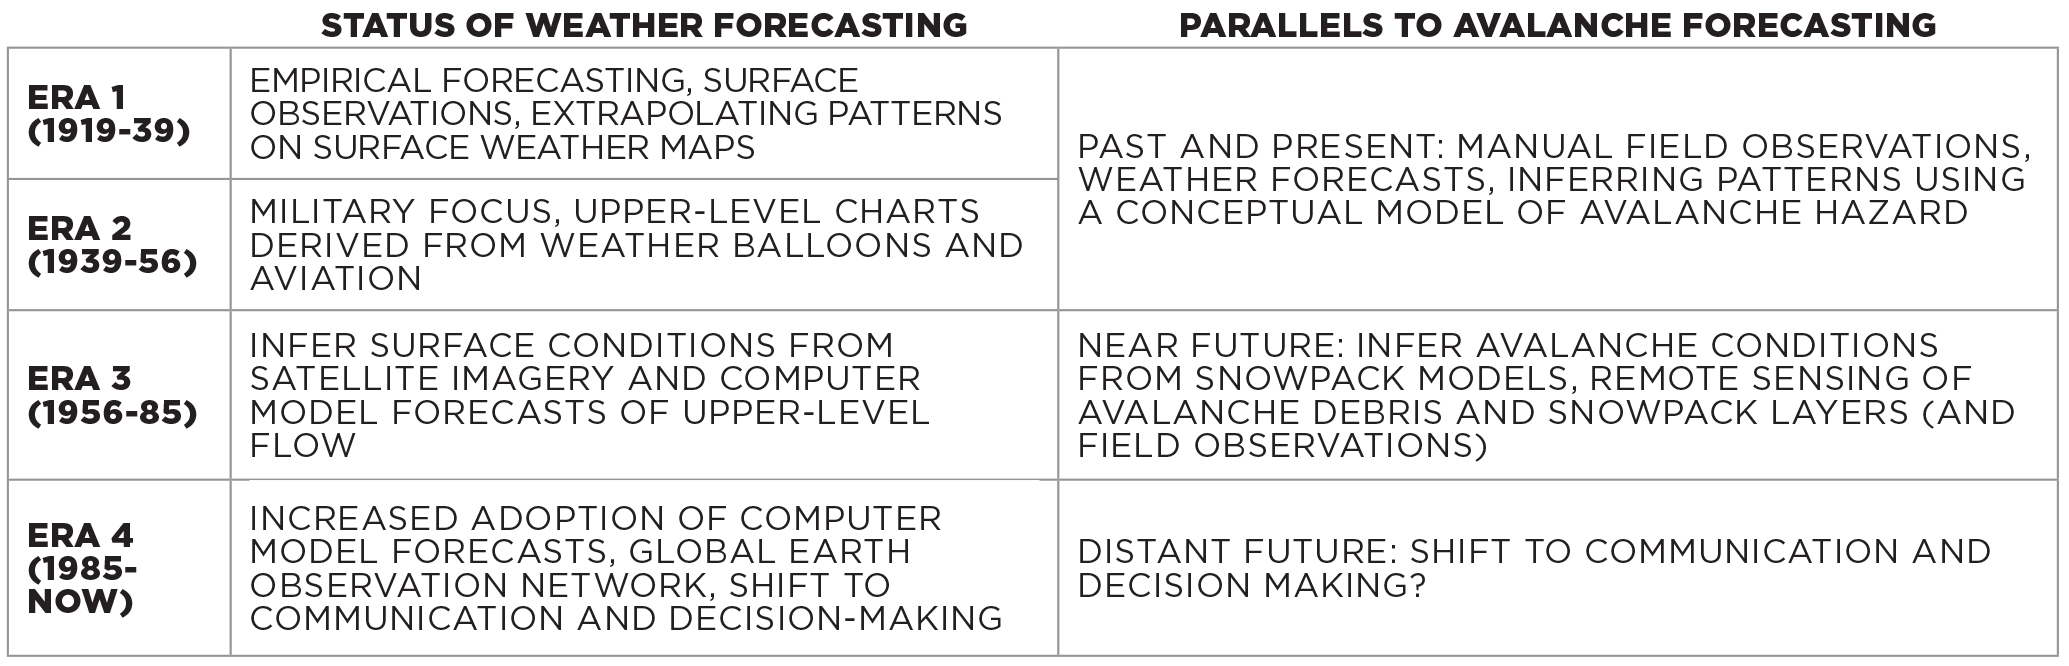
OBSERVATIONS AND PREDICTIONS
Modern weather forecasters use interactive dashboards that combine field observations, satellite imagery, and computer predictions to form a comprehensive picture of current and future weather conditions. Could this be what our workspaces look like in the future? Maybe instead of simply reviewing field observations from your own and neighbouring operations, a future avalanche forecasting tool will combine these observations with automated maps of avalanche activity, virtual snow profiles, and computer predictions of future conditions. to help form a more comprehensive picture of avalanche hazard. Even if it’s speculation, it’s important to understand the potential for technology to change avalanche work so we can shape it in a way that we all benefit.
The technologies impacting weather and avalanche forecasting broadly fit into two categories: ones that observe the conditions and ones that predict the conditions. In terms of observing conditions, weather satellites were the game changer that allowed us to expand from point observations to continuous spatial coverage. The same thing could happen with avalanche and snowpack observations. Networks of detectors that sense vibrations from avalanches are already installed, and recent research out of Europe has shown impressive accuracy in detecting avalanche debris in near real-time using radar-based satellites. Testing in Norway has found these satellites, which can even see through clouds, can provide updated daily maps of avalanche debris with complete spatial coverage across mountainous terrain. Imagine being able to see map of every avalanche that ran in Canada over the past 24 hours!
Remote sensors—from either satellites, aircrafts, drones, or on the ground—can also tell us about the snowpack. Deriving maps of snow-covered areas is already straightforward, but there is an increasing ability to sense snowpack layering remotely too. There are still many hurdles to getting actual x-ray vision into the snowpack—detecting thin weak layers is difficult, wet snow and crusts create a lot of errors, and all remote sensing technologies struggle in steep complex terrain. Advances in remote sensing are happening quickly, but most likely will need to be supplemented with other information to give us the best possible picture of avalanche conditions.
This is where prediction comes in. Our understanding of weather evolved in the 1920s with improved theories about the 3D structure of frontal systems. This didn’t have much impact on forecasting until several decades later when these theories were applied in computer models. This has become the backbone of modern weather forecasting.
Similar advances in snow science over the past decades have enhanced our understanding of how weak layers form, how avalanches release, and how they move downslope. The latest theories about snow microstructure and fracture mechanics are being implemented into computer models that simulate both the evolution of the snowpack structure as well as the movement of avalanches once they release. Could these models eventually have as much predictive power as weather models?
VIRTUAL SNOW PROFILES 
A VIRTUAL SNOW PROFILE CONTRASTED WITH A HAND DRAWN ONE // SIMON HORTON One promising forecasting application is computer models that simulate snow profiles with weather and terrain data. Some European countries started testing virtual snow profiles in the 1990s and Avalanche Canada started testing similar products 10 years ago with a focus on remote, data-sparse areas where the models could be driven with weather forecasts. (You may have seen these virtual profiles on ARFI.) Since their inception, the consistent question is, "How accurate are they?"
After 10 years of developing and testing these models for public forecasting in Canada, our impression is they provide a reasonable picture of general snowpack patterns, at least at some of the locations some of the time. Similar to how early weather models provided semi-realistic jet stream forecasts, the latest snowpack models can provide some big picture context to what is happening in the snowpack.
Weather models started being useful for big scale processes and we can expect snowpack models to follow suit. Rather than treating virtual profiles as slope-specific information, we can use snowpack models to look at regional differences in snowpack structure. For example, a surface hoar layer may form in the northern Monashees but not the southern Monashees because a storm tracking along the U.S. border causes too much cloud cover for surface hoar to form. Current applications of virtual snow profiles can already resolve some of these big-scale patterns. A focus of the avalanche research group at Simon Fraser University is developing ways practitioners can visualize and understand these patterns.
Weather models eventually grew from basic advisory tools to predictive powerhouses. A big reason they became more accurate in the 1980s and 1990s is they were fed with more observations of current atmospheric conditions. Uncertainties about the current weather (such as the initial conditions) is one of the main sources of errors in weather models. Over the past few decades, the amount of observations that could be collected by satellites, radars, and airborne sensors has exploded. Once the initial weather conditions are processed, computer models simply apply the laws of physics to figure out what will most likely happen next.
Similarly, the biggest source of uncertainty in snowpack models is figuring out when, where, and how much it snows. The most realistic virtual snow profiles are the ones at locations with good snowfall measurements or forecasts. Once snow is on the ground, the laws of physics do a pretty good job of figuring out how it evolves, but measuring and predicting snowfall is still hard, and even the best measurements and models currently fall short. We can expect to continue getting better at knowing how much it snows with better weather forecasts and observation networks. From there, we can get better at predicting the snowpack structure.
MERGING OLD AND NEW 
LEFT: METEROLOGY SERVICES OF CANADA RADAR IMAGE OF WESTERN CANADA // MSC RIGHT: WEATHER MAP FROM SCANDINAVIA FROM 1874 // WIKIPEDIA CREATIVE COMMONS Early weather models were considered advisory tools. Meteorologists would check their own jet stream forecasts against the computer forecasts to increase confidence in their predictions. Computer-based systems were brought into the loop to augment human capabilities rather than replace them. They were a thinking tool. What really changed the day-to-day operations of meteorologists was the development of tools that merged old methods with the new technology.
In the late 1990s, interactive computer dashboards were developed that allowed forecasters to visualize field observations, satellite imagery, and computer model forecasts all in one place. Bringing different sources of information together allowed forecasters to get the most complete picture, filter through all the information, and weight each type of data according to its strengths and weaknesses.
The InfoEx is a current example of a forecasting tool that helps us build an understanding of avalanche conditions based on field observations and analysis by fellow professionals. Perhaps a future version of the InfoEx could combine the information we currently use with satellite maps of avalanche debris and some fusion of a remotely-sensed and computer-simulated snowpack visualizations to give us a more complete picture of avalanche conditions. If designed effectively, such a tool should help us assess hazards faster, more efficiently, and more accurately.
There’s lots of talk about machine learning and losing work to automation. This is scary for a community that looks to the mountains for an escape from the chaos of the digitized world. These emerging technologies could change aspects of avalanche work, but they won’t automate it. The transformation of weather forecasting took decades, billions of dollars, and major international collaborations. Even with that, weather is (probably) still easier to predict than the delicate slope-scale processes that cause avalanches. Plus, meteorologists still have jobs—they just spend less time analyzing data and more time communicating and making decisions.
The hope is that integrating new technologies will improve our hazard assessments so we can focus our time and energy on risk mitigation. Computers are great at pattern recognition—better than humans in many fields—but thankfully avalanche forecasting is more than that. Computer predictions will need to be verified, interrogated, and interpreted by humans. Ultimately, the complex mitigation decisions are up to us. Field work may become more targeted, where the computer system identifies the greatest uncertainties that need to be resolved by sending field teams to answer specific questions.
There will certainly be a learning curve, perhaps a slow one, where we gradually learn what technology can offer. We should all be engaged to learn about how these technologies work and, more importantly, have our say on how they should be implemented so we can make informed decisions about the future of avalanche forecasting.
REFERENCES
Benjamin, S. G., Brown, J. M., Brunet, G., Lynch, P., Saito, K., and Schlatter, T. W., 2019. 100 years of progress in forecasting and NWP applications, Meteorological Monographs, 59, 13.11-13.67.
Eckerstorfer, M., Bühler, Y., Frauenfelder, R., and Malnes, E., 2016. Remote sensing of snow avalanches: Recent advances, potential, and limitations, Cold Regions Science and Technology, 121, 126-140.
Horton, S., Nowak, S., and Haegeli, P., in review. Enhancing the operational value of snowpack models with visualization design principles, Natural Hazards and Earth System Sciences.
Morin, S., Horton, S., Techel, F., Bavay, M., Coléou, C., Fierz, C., Gobiet, A., Hagenmuller, P., Lafaysse, M., and Ližar, M., 2019. Application of physical snowpack models in support of operational avalanche hazard forecasting: A status report on current implementations and prospects for the future, Cold Regions Science and Technology, 102910.
Tags:
avalanche forecasting
future
simon horton
technology
Permalink
| Comments (0)
|
|
|
Posted By Alex Cooper, Canadian Avalanche Association,
May 20, 2020
|
From volume 109, spring 2015
By Curtis Pawliuk
ALLEN CREEK RIDING AREA IN LOCATION KNOWN AS OLD HILLCLMB, SHOWING TYPICAL USE. NOTE OPTIONS FOR STUDY IN MIDDLE OF PHOTO // CURTIS PAWLIUK
IS CONSISTENT AND WIDESPREAD USE of more popular managed snowmobile areas creating a growing and dangerous sense of inflated experience and over confidence in mountain terrain?
British Columbia is home to approximately 85 snowmobile areas that are classified as managed. These managed areas are operated and overseen by local organizations and clubs in partnership with Recreation Sites and Trails BC, a department of the Ministry of Forest Lands and Natural Resource Operations.
Outside pressures like the Species at Risk Act and conflicts over land use are ultimately limiting motorized (snowmobile) access to many areas of the open backcountry. As access to BC’s backcountry becomes more restricted, the snowmobiling public is more likely to utilize these managed recreational snowmobile areas.
The word managed may be a bit misleading. The typical agreement has local clubs or organizations maintaining a groomed trail that may or may not lead to an alpine shelter as its final destination. Many of these access trails are mechanically groomed and are access points to a variety of areas, including treeline and alpine terrain. These “play” areas can see very heavy use by snowmobilers of all ages and riding abilities although there is no form of management beyond the end of the access trail.
Naturally some of these areas are quite a bit busier than others and some can see hundreds of users over any given weekend. Regular winter season use of these areas can begin as early as the beginning of November and continue on well into May.
One of the areas in BC I am most experienced with is Allen Creek. This is very large area that is bound on all sides by legislated wildlife closures, leaving boundaries that are quite clear. At times, especially during periods of extended drought, fresh lines can be difficult to find. Allen Creek is likely one of the most frequented managed snowmobile areas in Western Canada. The area holds a large mix of accessible terrain with ATES classifications ranging from non-avalanche terrain, simple, challenging and complex areas. All of the managed areas around BC have been ATES mapped through multi-year projects between Avalanche Canada and Recreation Sites and Trails BC.
Allen Creek holds the same features as any high alpine mountain environment, and after a busy week it is not uncommon to see 80% of the terrain within the area’s relatively large boundaries resembling a parking lot, with every morsel of snow absolutely steam rolled. This phenomenon begins at the start of the snowy season (generally mid-November) and typically ends in late April or early May depending on the year. Compaction of the annual snowpack within the area’s boundaries is extensive. During times of infrequent snowfall little terrain is left untouched. This includes slopes of 45-50 degrees or steeper, including concavities, convexities, creek beds, gullies, and all aspects and elevations at treeline and above.
Over the last eight seasons of frequenting these areas multiple times per week and having to regularly search for that elusive unaffected location for stability tests and snow profiles, I have spent a significant amount of time thinking about the effects of compaction in these popular public snowmobiling areas. Extensive snowmobile compaction not only has relevance to stability and avalanche hazard but it also exerts an influence on the riders in the form of human factors such as familiarity and scarcity.
ALLEN CREEK, LOCATION KNOWN AS SUPERBOWL. NOTICE THE HEAVY USE IN CHALLENGING TERRAIN // CURTIS PAWLIUK
As riders become more skilled and push the technical limits of their sport, be it strictly snowmobiling or snowmobile assisted ski touring, it has become increasingly difficult to find a location within Allen Creek (and many other managed snowmobile areas) that hasn’t met a season’s worth of sled or ski traffic. When I am able to find an untouched location, I begin to wonder—is it truly representative of the overall snowpack condition within the region?
As an area representative, acting as the general manager and avalanche technician for the local snowmobile organization and operating a snowmobile backcountry guiding and avalanche education business, I try to regularly convey important local information relating to the snowpack and riding conditions within these managed areas to our users via email lists, social media and general correspondence.
I often think about the effects of compaction within these popular areas. Managed snowmobile areas throughout BC receive hundreds if not thousands of user days per weekend, and many thousands per season. This does have a profound effect on the snowpack and the avalanche hazard within these regions; it is likely a contributing factor to why we don’t see more incidents involving snowmobilers given the nature of the terrain they travel in. The majority of the snowpack within managed areas is simply compacted to such an extent that it behaves more like a modified snowpack than it does like the less-frequented backcountry.
Much of the public rides in or travels through complex terrain. On any given winter day in BC, there are nonguided, recreational snowmobilers with unknown levels of training moving through large expanses of alpine terrain. Thankfully there are minimal reported avalanches, whether simple involvements or fatal accidents.
A few key questions come to mind regarding these managed public areas, the snowmobile use they see and the compaction that results:
• Does the extensive compaction in these heavily used managed areas result in non-event feedback, which is potentially developing a growing and dangerous sense of inflated experience and over-confidence in mountain terrain?
• Should this change our messaging to riders within specific regions?
• As professionals, how do we start to understand the role of compaction in these areas?
• When do we address this growing and likely inaccurate sense of self-confidence and complacency?
• If we do not openly discuss the idea of compaction within these areas and its potential benefits and dangers, are we withholding possibly life saving information?
• Should we communicate the effects of compaction in the public bulletin?
My personal feeling to many of these questions is yes, but how?
From my experience over the last eight years of observations, the heavily used managed recreational areas are providing a safer experience, with reduced avalanche hazard due to mechanical compaction. My feeling is that we address the idea in greater fashion. We can make our public avalanche safety programs stronger by recognizing and addressing the extensive compaction that regularly occurs at managed snowmobile areas. The question looms: how is this message most effectively delivered?
Not everyone chooses to utilize managed areas. Recreational users may seek out more elusive and secluded areas where regular compaction over a very large common area is no longer the case. This decision to push beyond compacted areas may come with time and/or the individual’s progression and experience level in the activity, or simply from a desire to find fresh tracks in times of low snowfall. They could also simply be following a blind desire to go off the beaten path even though their experience level may not be there. There are many human factors that influence us all, especially newcomers to mountainous terrain.
CLEMINA CREEK GOAT RIDGE BOWL. HEAVILY USED, PLANAR SLOPE REACHING UPWARDS OF 45°. NOTE LEFT OF PHOTO, NOT AS COMPACTED AND IS A REGULAR PERFORMER CAUSING A FATAL AVALANCHE IN THE 2013/2014 SEASON // CURTIS PAWLIUK
Due to their intense use, managed areas may be best looked at and discussed as a stepping stone to gaining experience with mountain terrain—to increase personal snowpack assessment and general backcountry skills before moving into large, less compacted snowpacks which arguably present a greater hazard.
As instructors, mentors and educators, when should compaction in managed snowmobile areas come into the conversation? Currently, I have not found anything addressing the idea that popular managed recreation areas may be safer due to the compaction phenomenon. There are many points that could be argued and all need a focused attention, though I have seen the benefits of compaction within these areas for many years.
I believe our lessons and correspondence to the recreational snowmobile community need to address a stronger message on the impacts of compaction in heavily frequented areas. That message may simply be that on a high hazard day, a managed area may provide a rider with a safer experience than the untouched and raw backcountry. However, I’m left with the question of how could we effectively convey this message without causing more harm than good?
Tags:
avalanche education
avalanche forecasting
compaction
snowmobiling
Permalink
| Comments (0)
|
|
|
Posted By Alex Cooper, Canadian Avalanche Association,
April 8, 2020
|
From volume 111, winter 2015-16
By Bree Stefanson

AVALANCHE CONTROL ON EAST STROHN PEAK. PHOTO: MOTI
I MOVED TO STEWART SEVERAL YEARS AGO to work in the BC Ministry of Transportation and Infrastructure Bear Pass Avalanche Program. The afternoon before my first day of work was my first time driving Highway 37A. My jaw dropped and my neck strained as my eyes tried to take in the complexity of the avalanche paths surrounding my truck. Within the first few hours on the job, I was in a helicopter finding out where my targets were and when to deploy the charges. Each of the sixty 25kg bags that went out of the door created avalanches, including numerous showy size 3s and a handful of movie-quality size 4s. It was like nothing I had ever seen. The large paths have a vertical fall of over 2,000m and avalanches can travel upwards of four kilometres before the mass crosses the highway. The mid-sized paths were a couple hundred metres higher than the vertical fall of Castle Mountain Resort, where I had worked as a ski patroller. The smaller paths can bury a vehicle or push one into a lake.
The pass taught me a lot my first season. For example, the center of an approaching low-pressure system can slip a little south and surprise you by sneaking in the backdoor with outflow winds. Amazingly, the large avalanche paths can retain what seems to be an infinite amount of load and are capable of producing size 5 avalanches. An impressive display of nature, the large avalanches command respect for the potential damage they can produce. It was hard not to get caught up in focusing on the large paths, but the “small” paths can still put a size 3 on the road. Also, the importance of clear, timely communication to the public became paramount when living in a community that becomes isolated once the road closes.
Coming into my second season I had a better idea of what to look for and what to expect. I also knew that I had just experienced an “average” season and hadn’t seen anything “above average.” I had come to appreciate the forecasting process which was well-established within the program. This process assesses the overall avalanche hazard for an unmodified snowpack and then applies that assessment to each individual path throughout the forecast area, taking significant occurrences into account. The paths are then individually ranked on the Ministry’s five level hazard scale to identify the paths of concern and dictate specific operational procedures that the maintenance contractor is required to follow while working within the avalanche area.

FRACTURE PROFILE ON ORE MOUNTAIN. PHOTO: MOTI
The 2014-15 season started warm and wet with average amounts of precipitation, but freezing levels were often above 1,000m. In the alpine, a significant instability was buried in the fall, and by Christmas a hard slab had developed over top. When we issued a Future Planned Event notifying our stakeholders that the highway would be closed for avalanche control, you can only imagine the feedback we got from surprised locals, as there wasn’t a flake to be found in town. The control mission was successful, with avalanches to size 4 crawling over nearly bare ground and terminating within 200m of the highway. This mission greatly reduced mass from our alpine start zones, and even though we had large deposits visible from the road, no one in town was buying my story.
The first time I heard the term “atmospheric river,” a significant storm that was forecast to track well to the south had shifted its course and was headed towards Stewart. The millimetres were stacking up on the XTs and we were all trying to forecast the effects of 100mm in a 30-hour period on our snowpack. We compared the various forecast models, attempting to pinpoint the peak of the storm. We applied the forecast to our current snowpack and attempted to hypothesize the timing and character of the expected avalanche cycles. Our theory was that there would be too much rapid loading for the paths to retain significant mass, and the paths would shed during peak loading. We anticipated the freezing levels to rise and induce a secondary wet cycle as the snowpack became saturated. With saturated runout zones, deposits from large avalanches initiating later in the storm would slow down, ideally stopping above the road. We planned a control mission for the peak of the storm, targeting rain-saturated paths below treeline. This closure would also empty the road of travelling public, allowing us to get a handle on the avalanche character and where the deposits were actually stopping without added pressure.
The storm was intense, starting with 3-5mm H2OE per hour, steady for hours. Twelve hours into the storm, snow levels were above 1,100m and precipitation rates had reached up to 7.4mm an hour. I was relieved once the road was closed for control, as the large paths were retaining their mass.
AN AVALANCHE DUSTS BEAR PASS. PHOTO: MOTI
Fortunately, the ceiling was high enough to access the below treeline start zones and the snowpack was saturated enough to release wet loose and slab avalanches. After a three hour mission, our BTL concerns were mitigated and we had plenty of daylight to fly through the pass to observe the natural occurrences. Sure enough, as we flew by, we saw every large alpine and mid-elevation path had healthy deposits below them, with all deposits stopping above the highway. We ran through our path hazard avalanche risk table and all of our paths of concern had released, with any residual hazard still falling well within our operational risk band. We made the call to open the road and continued to monitor avalanche activity.
The storm ended as fast as it came. When it was all said and done, Stewart had received 146mm over a couple of days with 110mm falling within a 24-hour period. This exceeded by twice as much the previously recorded maximum precipitation amount for a 24-hour period in Stewart in March.
At first light I drove through the pass with the clear morning sky showing crowns throughout the pass. By 10:00 a.m., the wind increased, grabbing all the new snow available for transport and quickly erasing the crowns.
Fortunately, the weather continued to improve and conditions were favourable for control the following day. We spent most of our mission above the treeline, producing numerous size 3 to 3.5 avalanches and a few size 4s. The deposits of these reloaded paths easily traveled over the debris piles produced during the storm, with some just stopping shy of the road. The avalanches were stunning. They were dry and moving fast until they hit the saturated snow, where they’d push a slow moving finger of wet mass through the run-out zone. It was impressive to see the power of the air blasts from the two plunging avalanches that dusted the road.
A PANORAMA OF THE FRACTURE LINE ON ORE MOUNTAIN. PHOTO: MOTI
Following the mission, I drove through the pass to capture the toe distance mass of the deposits, and I reflected on the storm, the natural cycles and the control missions. I thought about the various avalanche path characteristics over the elevation bands and the many avalanche problems I had just seen. In one storm there was storm slab, persistent slab on surface hoar, large plunging, loose dry, loose wet, and wet slab, as well as the potential for large avalanches to detach huge fins of glacial ice amplifying the deposit size. I was glad that we had eliminated the deep slab problem formed earlier in the season as it had become active in slopes adjacent to the forecast area, and this would have increased the magnitude of the impacts to the highway during the storm.
The Bear Pass is a wild place to work during a significant storm event, and the area provides a fabulous opportunity to learn a lot about avalanches. I am grateful to have seen an event like this and to have had such a solid team to work with through the season. I’m now in my third season in the pass and from the deposits I’ve seen in the archived photos, all I really know is that I have a whole lot more to learn.
Tags:
avalanche forecasting
bear pass
bree stefanson
Permalink
| Comments (0)
|
|
|
Posted By Alex Cooper, Canadian Avalanche Association,
March 4, 2020
|
From vol. 119, winter 2018-19
By Laura Maguire and Jesse Percival

WITH UNCOMMON SNOWPACKS BECOMING INCREASINGLY COMMON, PRACTITIONERS IN A COASTAL SNOWPACK HAVE BEGUN DEPLOYING NEW STRATEGIES // JESSE PERCIVAL
COGNITIVE SYSTEMS ENGINEERING (CSE) demonstrates how expert practitioners in high risk/high consequence domains make sense of risk in dynamic, ambiguous and changing conditions. Expert performance is identified as going beyond qualifications to include the ability to activate, organize and flexibly apply knowledge (Woods et al, 2010) in time pressured, goal conflicted and uncertain conditions. To do so involves cognitive work.
Using methods from CSE, this study assessed the operational aspects of snow safety then analyzed the artifacts (tools such as worksheets, websites, whiteboards, InfoEx, etc.) that shape cognition and collaboration. Semi-structured interviews were used to detail how tools are used to make and update forecasts over time. Finally, we elicited examples of surprise, near misses and actual incidents to calibrate findings.
Three prominent, interconnected themes emerged from the research:
- Much of the cognitive work is not described in the explicit protocols. The formal representations of what constitutes good practice in forecasting is a small fraction of the strategies experts use.
- The cognitive effort required to manage avalanche risk is a near continuous activity. Forecasting appears to require ongoing calibration. Disruptions to this calibration process have adverse effects on performance.
- Forecasting is a distributed cognitive task across individuals, teams and the broader industry. Successful forecasting requires distributed practitioners of local team members as well as the resources and insights produced by others within the industry.
PREPARATIONS FOR FORECASTING
Formally, the protocols for a forecaster on duty (FOD) suggests producing a control plan shortly after arriving onsite - but each forecaster interviewed detailed extensive preparations that were not captured by the formal description. A variety of work-related techniques were described. For example, time spent carpooling is used as an informal handoff from one FOD to another to discuss recent activity or control measures. This suggests that formulating the day’s forecast begins well in advance so that a forecaster arrives for duty with a hypothesis of how recent changes in conditions affect their avalanche terrain management.
Shared, off the books activity is a common (and likely necessary) practice not explicitly noted in work procedures and demonstrates a need for ongoing calibration – an example that supports all three findings. It is well documented that forecasting takes place under time pressure. By seeking out data that can help them anticipate conditions in advance, the FOD relieves some of this pressure to lessen the cognitive demands required once they officially clock in.
DISRUPTION, ADAPTATION & SURPRISE
A second example: An unexpected in-bounds release. On this day, the forecasting plan had anticipated instabilities due to temperature changes. After control work, it was expected that normal monitoring would identify if a closure was necessary. However, a personal emergency meant the team was operating one person short. Concurrently, a first aid emergency tied up members who would otherwise be monitoring avalanche terrain. This left the FOD ‘in the bump’ for longer than the usual rotation and his normal practice was interrupted. As expected, the temperature fluctuated and a skier-triggered release occurred in one of the avalanche zones.
This example is informative in two ways. Firstly, it is reflective of what “normal work” is – constantly adjusting to workload demands or unavailability of resources and adapting practices to respond to conditions while balancing inevitable trade-offs. Secondly, this example provides evidence that practitioners construct mental models (Adams, 2005) and continually update them.
MENTAL MODELS
The model is an internal representation of current hazards and an expectation of how this may change over time. Mental models are used to retrieve technical knowledge and to flexibly apply it to variable situations.
In constantly changing conditions, mental models become stale unless continually updated. Referring to the in-bounds avalanche example, the model became insufficient after only a few hours. In the previous example, the forecaster coming back from time off is aware their model is stale and seeks information to recalibrate. LaChapelle (1980) notes a “...prevalent and strong reluctance of working forecasters to experience an interruption in their winter routine…” (pg. 78).
This finding emphasizes organizing work schedules to protect forecasters’ daily and seasonal monitoring routine from interruptions or building in mechanisms to support rapid recalibration or redundancy by cross-checking across other team members.
THE BIG PICTURE - MOUNT WASHINGTON // COLE RAMSHAW
DISTRIBUTED COGNITIVE EFFORTS
Notable as well, is the role of a distributed network in constructing mental models. A diverse range of perspectives informed by different experiences, knowledge and mindsets is needed for accuracy. In the resort, the schedule for FOD’s is designed to provide an overlap day to accommodate the need for distributed cognition. This is an explicit recognition of both ensuring currency of the mental model and the importance of interactions between practitioners. Updating provides an opportunity to draw attention to details and to generate shared insights.
Spatial and temporal constraints also require distributed cognitive efforts. Large terrain and limited daylight hours create time pressures. The FOD relies on technicians to gather and relay data effi ciently and accurately. Without the team, the FOD’s mental model can only partially represent actual conditions.
CONCLUSIONS
Errors by normally high performing experts are insights into how the cognitive demands may become temporarily overwhelming. Studies like this illustrate what aspects of practice should be protected from the pressures of ‘faster, better, cheaper’ common in many workplaces and allows for better engineering of the tools, technologies and protocols used.
Further research can provide an empirical basis for: designing decision support tools; developing training; orchestration & distribution of tasks; funding critical resources; and developing new forms of coordination across networks. Identifying cognitive work in different forecasting settings (mechanized skiing, transportation, industrial) is likely to be useful for accident prevention. In addition, CSE studies comparing expert vs recreational cognition is likely to help public safety efforts.
The authors gratefully acknowledge the Avalanche Canada Foundation for their travel support through the ISSW Fund and the Cora Shea Memorial Fund. For the complete proceedings paper or more information about this and other projects in cognitive work of avalanche forecasting contact Laura (maguire.81@osu.edu) or Jesse (jperceival@mountwashington.ca)
REFERENCES
Adams, L. (2005). A systems approach to human factors and expert decision-making within Canadian Avalanche Phenomena. MALT Thesis. Royal Roads University, Victoria, BC, 284.
LaChapelle, E. R. (1980). The fundamental processes in conventional avalanche forecasting. Journal Glaciology, 26(94), 75–84.
Woods, D., Dekker, S., Cook, R., Johannesen, L., Sarter, N. (2010). Behind Human Error. London: CRC Press.
Tags:
avalanche forecasting
cognitive systems engineering
jesse percival
laura maguire
Permalink
| Comments (0)
|
|