  
|
Posted By Administration,
February 10, 2021
|
From volume 119, winter 2018-19 By Laura Maguire and Jesse Percival COGNITIVE SYSTEMS ENGINEERING (CSE) demonstrates how expert practitioners in high risk/high consequence domains make sense of risk in dynamic, ambiguous and changing conditions. Expert performance is identified as going beyond qualifications to include the ability to activate, organize and flexibly apply knowledge (Woods et al, 2010) in time pressured, goal conflicted and uncertain conditions. To do so involves cognitive work.
Using methods from CSE, this study assessed the operational aspects of snow safety then analyzed the artifacts (tools such as worksheets, websites, whiteboards, InfoEx, etc.) that shape cognition and collaboration. Semi-structured interviews were used to detail how tools are used to make and update forecasts over time. Finally, we elicited examples of surprise, near misses and actual incidents to calibrate findings.
Three prominent, interconnected themes emerged from the research:
- Much of the cognitive work is not described in the explicit protocols. The formal representations of what constitutes good practice in forecasting is a small fraction of the strategies experts use.
- The cognitive effort required to manage avalanche risk is a near continuous activity. Forecasting appears to require ongoing calibration. Disruptions to this calibration process have adverse effects on performance.
- Forecasting is a distributed cognitive task across individuals, teams and the broader industry. Successful forecasting requires distributed practitioners of local team members as well as the resources and insights produced by others within the industry.

MT. WASHINGTON FORECAST TEAM EXAMINING THE SNOWPACK AND MENTORING NEW MEMBER // JESSE PERCIVAL PREPARATIONS FOR FORECASTING
Formally, the protocols for a forecaster on duty (FOD) suggests producing a control plan shortly after arriving onsite - but each forecaster interviewed detailed extensive preparations that were not captured by the formal description. A variety of work-related techniques were described. For example, time spent carpooling is used as an informal handoff from one FOD to another to discuss recent activity or control measures. This suggests that formulating the day’s forecast begins well in advance so that a forecaster arrives for duty with a hypothesis of how recent changes in conditions affect their avalanche terrain management.
Shared, off the books activity is a common (and likely necessary) practice not explicitly noted in work procedures and demonstrates a need for ongoing calibration – an example that supports all three findings. It is well documented that forecasting takes place under time pressure. By seeking out data that can help them anticipate conditions in advance, the FOD relieves some of this pressure to lessen the cognitive demands required once they officially clock in.
DISRUPTION, ADAPTATION & SURPRISE
A second example: An unexpected in-bounds release. On this day, the forecasting plan had anticipated instabilities due to temperature changes. After control work, it was expected that normal monitoring would identify if a closure was necessary. However, a personal emergency meant the team was operating one person short. Concurrently, a first aid emergency tied up members who would otherwise be monitoring avalanche terrain. This left the FOD ‘in the bump’ for longer than the usual rotation and his normal practice was interrupted. As expected, the temperature fluctuated and a skier-triggered release occurred in one of the avalanche zones.
This example is informative in two ways. Firstly, it is reflective of what “normal work” is – constantly adjusting to workload demands or unavailability of resources and adapting practices to respond to conditions while balancing inevitable tradeoffs. Secondly, this example provides evidence that practitioners construct mental models (Adams, 2005) and continually update them. 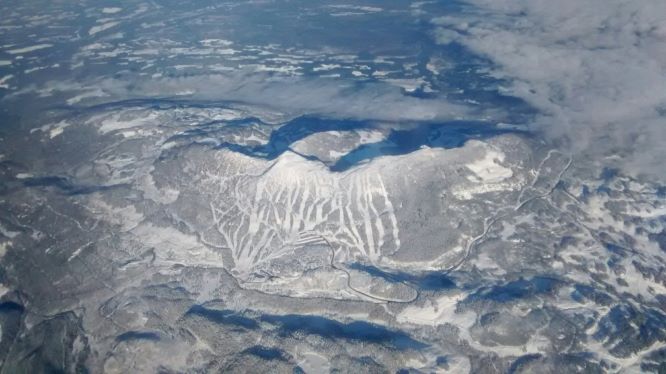
THE BIG PICTURE - MOUNT WASHINGTON // COLE RAMSHAW
MENTAL MODELS
The model is an internal representation of current hazards and an expectation of how this may change over time. Mental models are used to retrieve technical knowledge and to flexibly apply it to variable situations.
In constantly changing conditions, mental models become stale unless continually updated. Referring to the in-bounds avalanche example, the model became insufficient after only a few hours. In the previous example, the forecaster coming back from time off is aware their model is stale and seeks information to recalibrate. LaChapelle (1980) notes a “...prevalent and strong reluctance of working forecasters to experience an interruption in their winter routine…” (pg. 78). This finding emphasizes organizing work schedules to protect forecasters’ daily and seasonal monitoring routine from interruptions or building in mechanisms to support rapid recalibration or redundancy by cross-checking across other team members.
DISTRIBUTED COGNITIVE EFFORTS
Notable as well, is the role of a distributed network in constructing mental models. A diverse range of perspectives informed by different experiences, knowledge and mindsets is needed for accuracy. In the resort, the schedule for FOD’s is designed to provide an overlap day to accommodate the need for distributed cognition. This is an explicit recognition of both ensuring currency of the mental model and the importance of interactions between practitioners. Updating provides an opportunity to draw attention to details and to generate shared insights.
Spatial and temporal constraints also require distributed cognitive efforts. Large terrain and limited daylight hours create time pressures. The FOD relies on technicians to gather and relay data efficiently and accurately. Without the team, the FOD’s mental model can only partially represent actual conditions.

WITH UNCOMMON SNOWPACKS BECOMING INCREASINGLY COMMON, PRACTITIONERS IN A COASTAL SNOWPACK HAVE BEGUN DEPLOYING NEW STRATEGIES // JESSE PERCIVAL
CONCLUSIONS
Errors by normally high performing experts are insights into how the cognitive demands may become temporarily overwhelming. Studies like this illustrate what aspects of practice should be protected from the pressures of ‘faster, better, cheaper’ common in many workplaces and allows for better engineering of the tools, technologies and protocols used.
Further research can provide an empirical basis for: designing decision support tools; developing training; orchestration & distribution of tasks; funding critical resources; and developing new forms of coordination across networks. Identifying cognitive work in different forecasting settings (mechanized skiing, transportation, industrial) is likely to be useful for accident prevention. In addition, CSE studies comparing expert vs recreational cognition is likely to help public safety efforts.
The authors gratefully acknowledge the Avalanche Canada Foundation for their travel support through the ISSW Fund and the Cora Shea Memorial Fund. For the complete proceedings paper or more information about this and other projects in cognitive work of avalanche forecasting contact Laura (maguire.81@osu.edu) or Jesse (jperceival@mountwashington.ca)
REFERENCES:
Adams, L. (2005). A systems approach to human factors and expert decision-making within Canadian Avalanche Phenomena. MALT Thesis. Royal Roads University,
Victoria, BC, 284.
LaChapelle, E. R. (1980). The fundamental processes in conventional avalanche forecasting. Journal Glaciology, 26(94), 75–84.
Woods, D., Dekker, S., Cook, R., Johannesen, L., Sarter, N. (2010). Behind Human Error. London: CRC Press.
Tags:
avalanche journal
cognitive systems
laura maguire
Permalink
| Comments (0)
|
|
|
Posted By Administration,
February 3, 2021
|
From volume 74, Fall 2005 By Cam Campbell
Many British Columbians believe that the El Niño-Southern Oscillation index (ENSO) provides a hint of the winter to come. If the index is in a strong El Niño (warm phase), BC’ers gear up for a fat snowpack season. We all remember the winter of 1999: strong El Niño and record snowfall in southwestern BC (Figure 1). This study looks at the validity of using the ENSO and other climatic indices to predict the winter to come. For this study, winter (February 1st) and spring (April 1st) water equivalent of the snowpack (SWE) for seven regions in BC were correlated with four different climatic indices: ENSO, Pacific North American (PNA), Pacific Decadal Oscillation (PDO) and North Pacific (NP).
Motivation for this article came from meteorologist David Jones’ presentation at the 2004 Backcountry Avalanche Workshop on using ENSO as a predictor for West Coast snowfall. In his presentation, David showed that above-average snowfall on the West Coast is sometimes associated with a strong ENSO (warm or cold) but overall the correlation is relatively weak. Several other studies have focused on the relationships between snowpack and hydrologic variability and climatic fluctuations, especially in the Western United States (e.g. Yarnal and Diaz 1986; Cayan and Peterson, 1989; Koch et al., 1991; Redmond and Koch, 1991; Cayan and Webb, 1992; Chagnon et al., 1993; Dracup and Kahya, 1994; McCabe, 1994; Sittel, 1994; Ropelewski and Halpert 1996; Mason and Goddard 2001; Smith and O’Brien 2001; Patten et al., 2003; and the list goes on) but few in Canada (e.g. Moore and McKendry, 1996; Moore and Demuth, 2001). 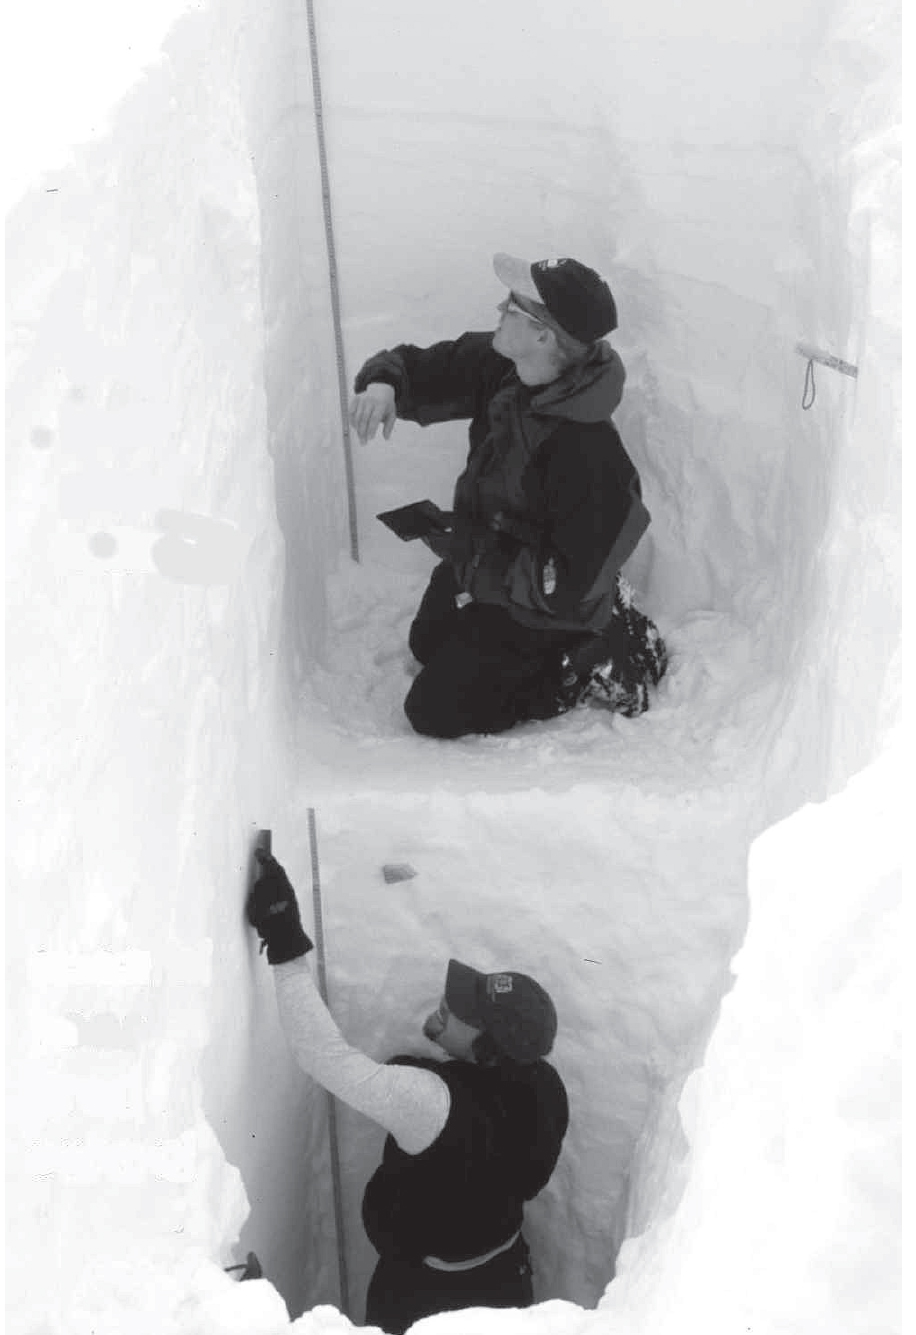
Figure 1 – Full-depth profile at Fidelity Mtn. in the Columbia Mtns. during the winter of 1999 (Applied Snow and Avalanche Research, University of Calgary (ASARC) photo).
El Niño-Southern Oscillation (ENSO)
The ENSO index is calculated from the standardized pressure difference between Tahiti and Darwin, a small fishing village on the Chilean coast, and represents the effects of an El Niño event on the strength of the equatorial easterlies (Moore and Demuth, 2001). The occurrence of blocking in the Bering Strait is sensitive to the phase of the ENSO cycle and the frequency of blocking is most strongly influenced by the ENSO in January and February (Renwick and Wallace, 1996).
“Blocking” refers to the breakdown of the prevailing mid-latitude westerly flow in the troposphere which produces persistent ridging over the northeast boundary of the Pacific, effectively blocking fronts associated with cyclonic activity over the Aleutian Islands from reaching BC. Sixty-nine percent more days of blocking occurred during the cold phase of the ENSO cycle than during the warm phase, and the frequency of blocking days is 40% lower during the warm phase of the ENSO compared to other winters (Renwick and Wallace, 1996).
North Pacific (NP)
Trenberth and Hurrell’s (1994) NP index represents the intensity of the Aleutian Low in winter and is the anomaly of the areaweighted mean sea level pressure to the mean between 1925 and 1988 for a given area over the North Pacific. Air temperature has been negatively correlated with the North Pacific (NP) index. That is, warm winters are associated with low NP values, whereas precipitation shows a weak positive correlation with NP (Moore and McKendry, 1996).
Pacific Decadal Oscillation (PDO)
As the name suggests, the PDO index is based on oscillations that occur somewhere in the Pacific Ocean every 10 years or so. In fact, it is the time series scores associated with the leading principle component of sea surface temperature in the Pacific Ocean, north of 20°N (Zhang et al., 1997). A positive PDO (warm phase) represents warmer than average water in the equatorial Pacific and colder than average water in the North Pacific, vice-versa for a negative (cold phase) PDO. Moore and Demuth (2001) found that snow accumulation tends to be greater during PDO cold phase winters, which explains lower observed winter accumulation after 1976 when PDO shifted from its cold phase to the present warm phase.
Pacific North American (PNA)
At 55 years old, the PNA index is the youngest used in this study. The PNA index is a mode of winter atmospheric circulation which is naturally and internally generated (Wallace and Gutzler, 1981). Positive values of the PNA (enhanced phase) represent an enhanced Rossby Wave over Western North America with southerly to southwesterly flow over the West Coast which results in warm advection into the southern Coast Mountains (Moore and Demuth, 2001). Moore and McKendry (1996) found that BC winters dominated by enhanced PNA produced overall shallower than average spring snowpack. Intensification of the PNA
index is associated with southwesterly flow over the eastern north Pacific which is likely to cause increased freezing levels and less precipitation, and result in less snow accumulation (Moore and McKendry, 1996).
Methods
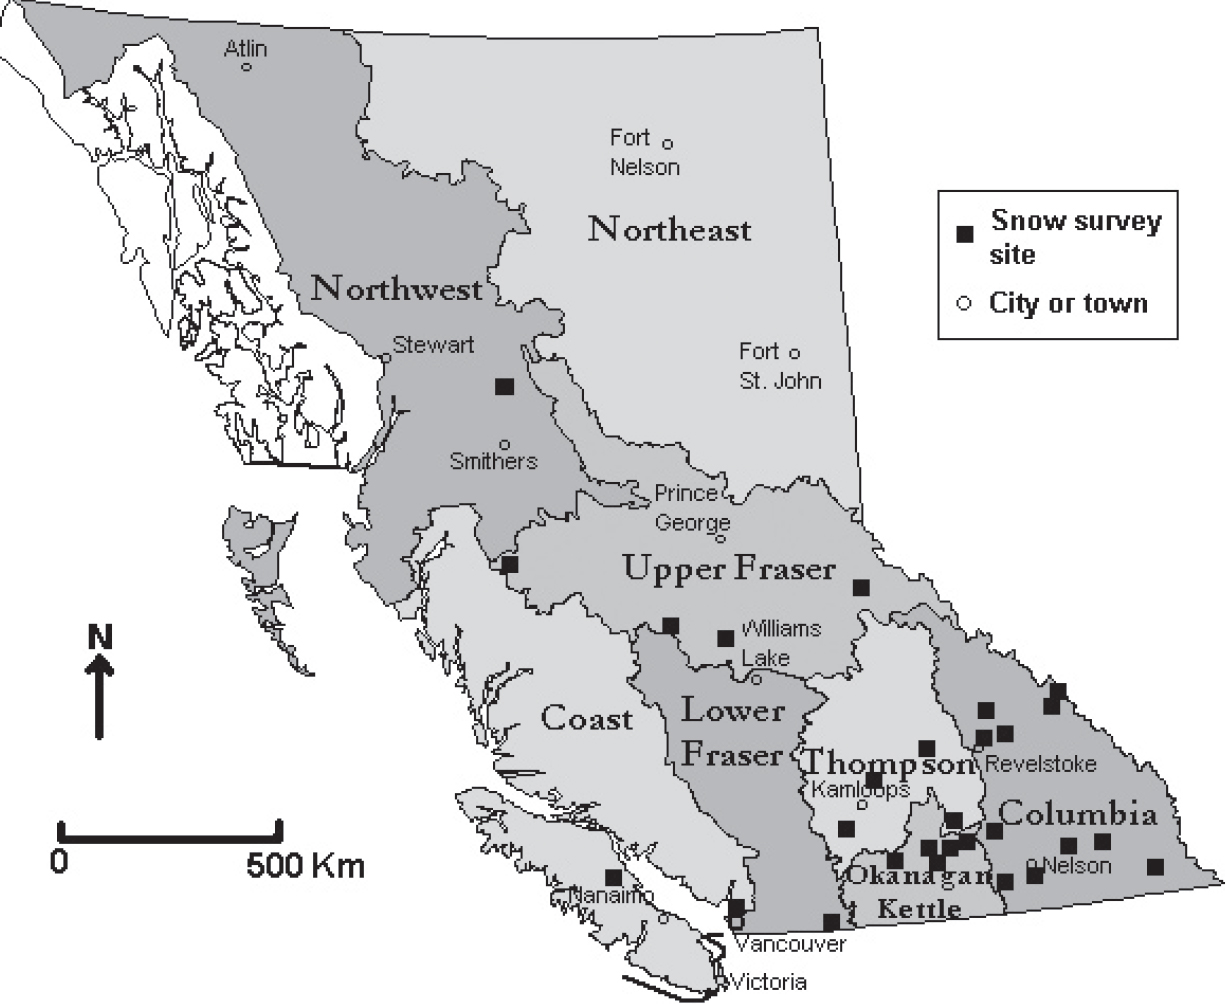
Figure 2 – Map of British Columbia showing the eight regions: Northwest, Northeast, Coast, Upper Fraser, Lower Fraser, Thompson, Okanagan-Kettle and Columbia. The snow survey sites used in this study and landmark cities or towns are also marked (Source: British Columbia Ministry of Water, Land and Air Protection) The BC Ministry of Water, Land and Air Protection (MWLAP) divided the province into eight regions based largely on major drainages. Figure 2 shows the eight regions and the snow survey sites used in this study. The first thing you’ll notice is a lack of sites in the northern half of BC In fact, no sites were used in the Northeast region due to insufficient data so you can disregard the Northeast. The southern regions, on the other hand, have sites with historical data dating back to the mid-1930s. For the sake of statistical significance an emphasis has been placed on the southern half of the province.
Yearly SWE data collected on, or within a few days of, February 1st and April 1st were obtained from the MWLAP’s River Forecast Centre website. The regional average SWE was determined by averaging the SWEs from all snow survey sites used in that particular region. For the case of the Columbia region this means 11 sites (Figure 2), whereas due to insufficient data only one site was used to represent the Lower Fraser and Northwest regions. In order to maintain spatial bias, the average of all regional average SWEs was used to represent the provincial average.
Table 1 lists the websites from which climatic index data were obtained. Most people would agree that the snow usually starts accumulating in the BC mountains sometime in November. For this reason SWE data on February 1st were correlated with the average index values for the previous three months (November, December and January) and SWE data on April 1st were correlated with the average index values for the previous November to March. In doing this, the total amount of snow on the ground is only compared to the index values of the months during which it accumulated.
Table 1 – Websites used to obtain climatic index data 
Since all the data were normally distributed, Pearson linear correlation analysis was used to describe the associations between SWE and the climatic indices. Pearson’s R statistic describes the strength of the correlation, with a perfect linear correlation represented by R = 1. The p-value is a function of R and the sample size (N) that quantifies the confidence in the correlation. In this case N corresponds to the number of years in which data were available. Multivariate least-squares linear regression was used to describe the influences that two or more variables may have on a single variable. Multivariate regression analysis produces a Coefficient of Multiple Determination (R2), which is essentially an R statistic for linear associations in more than two dimensions. In order to directly compare the results from the two analysis techniques, Pearson’s R statistic was squared. In accordance with most scientific studies, all correlation and regression coefficients were considered statistically significant at the p < 0.05 level. This means that there is a 5% chance of a Type II error where a coefficient is considered to be statistically significant when in fact it is not.
Results
Provincial
Figure 3 shows time series plots of yearly average PDO, PNA, NP and ENSO indices and provincially averaged SWE for both February 1st and April 1st from 1935 to 2004 (except PNA which doesn’t start until 1950). Consider the three-year period from 1940 to 1942. These winters were characterized by some of the lowest SWE on record and a period of strong La Niña, strong negative NP and strong positive PDO conditions. Now consider the winter of 1999. As
mentioned before, this winter was characterized by high SWE across the province which coincides with strong El Niño, strong negative PDO and relatively weak positive PNA and NP conditions. Interpretation of the remainder of Figure 3 will be left up to the reader.
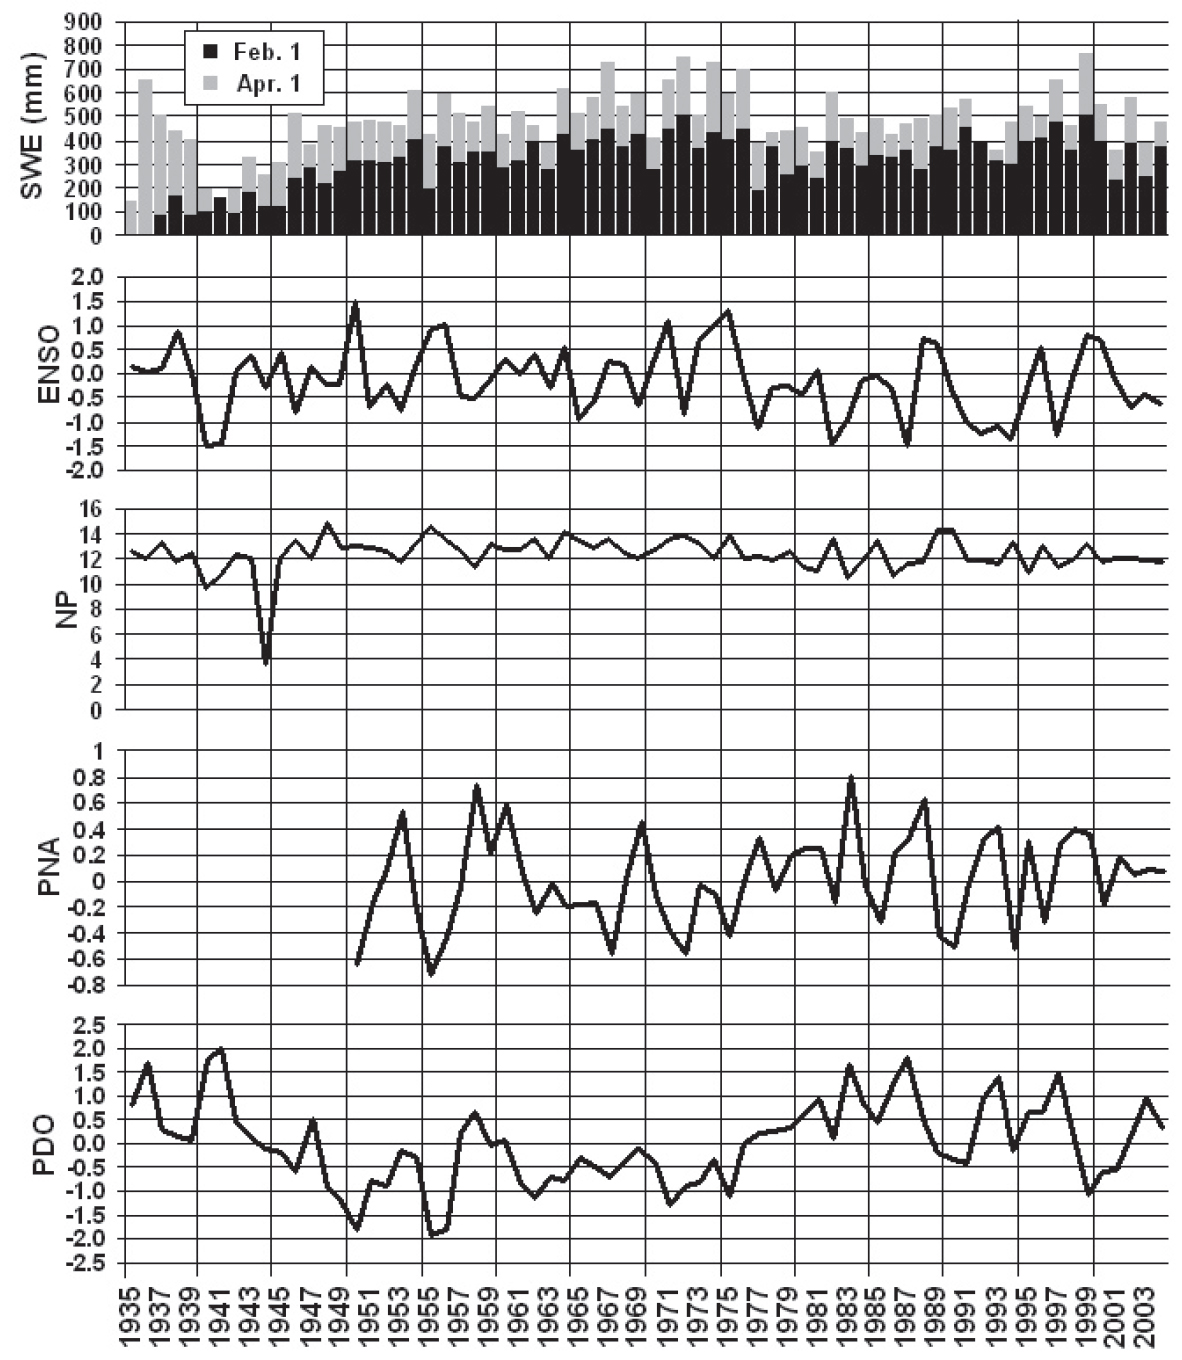
Figure 3 – Time series of the yearly averages of monthly Pacific Decadal Oscillation (PDO), Pacific North American (PNA), North Pacific (NP) and El Niño-Southern Oscillation (ENSO) index data from 1935 to 2004. Also shown is the provincially averaged Snow Water Equivalent (SWE) for both February 1st and April 1st from 1935 to 2004 (except PNA which doesn’t start until 1950). There is no February 1st SWE data for 1935 and 1936.
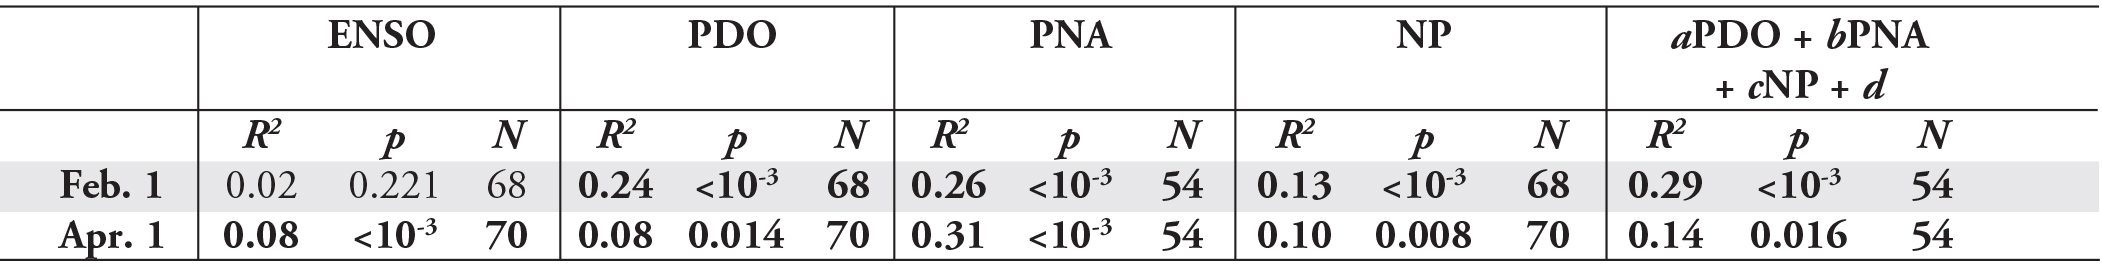
At first glance, it would appear that ENSO’s performance is lacking compared to the other indices (Table 2). The correlation with February 1st SWE wasn’t significant and although significant, the correlation with April 1st SWE was weak compared to the other indices. PNA was the best performer, in terms of predictive merit, for both April 1st and February 1st provincial SWE. It is also interesting to note that the correlations with ENSO and NP are positive (i.e. a strong El Niño or NP index corresponds to a high SWE) whereas the correlations with the other indices are negative. Of course, this cannot be seen in Table 2 as all the correlation coefficients have been squared.
Multivariate least-squares linear regression was used to assess the predictive merit of the top three performing indices combined. In this case, PDO, PNA and NP were used according to the following equation:
SWE = aPDO + bPNA + cNP + d (1) When the three indices are combined, the R2 for February 1st SWE was greater than for any individual index, suggesting that more variability can be explained by combining of PDO, PNA and NP. This, however, is not the case for April 1st SWE, where PNA outperforms the combined indices.
Table 2 – Squared Pearson linear correlation coefficients (R2) for the correlations between February 1st and April 1st provincially averaged SWE and each of the four climatic indices. The coefficient of multiple determination (R2) for the equation: SWE = aPDO + bPNA + cNP + d is also given. All coefficients which have a p < 0.05 are marked in bold.
Regional
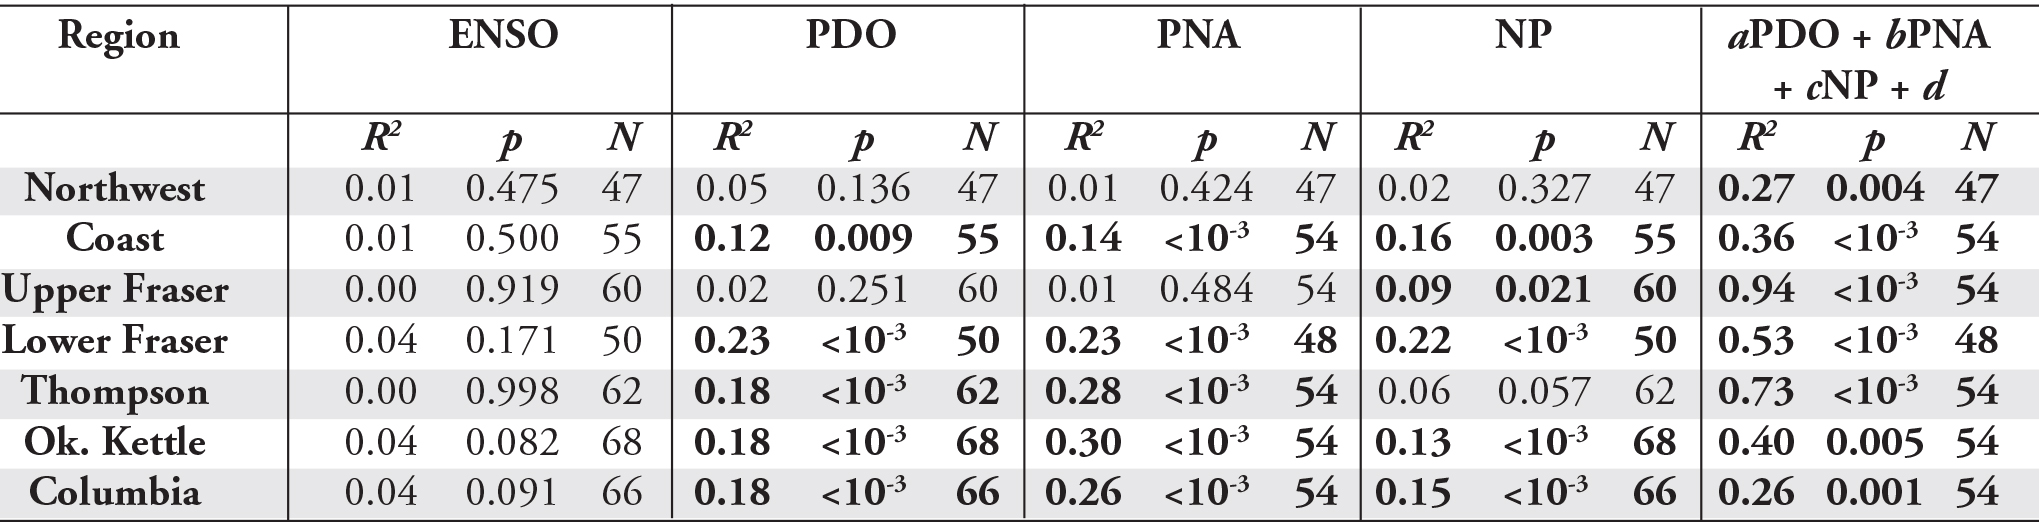
Once again PDO, PNA and NP in Table 3 seemed to outperform ENSO with more statistically significant correlations and higher overall correlation coefficients. In fact, none of the regions had significant correlations between ENSO and February 1st SWE. All correlations with ENSO and NP are again positive, while all correlations with PDO and PNA are negative. All regions, except the Northwest, had significant correlations between at least one index and February 1st SWE. Once again, PNA seemed to be the best performing index for February 1st SWE, especially for the Thompson, Okanagan-Kettle and Columbia regions. Multivariate least-squares linear regression was again used to assess the combined predictive merit of the PDO, PNA and NP indices based on Equation 1. By combining the three indices, the ability to predict February 1st SWE for all regions, except the Columbia region, was improved. In fact, for the Upper Fraser region the three indices were able to account for 94% of the variability in February 1st SWE.
Table 3 – Squared Pearson linear correlation coefficients (R2) for the correlations between February 1st regionally averaged SWE and each of the four climatic indices. The coefficient of multiple determination (R2) for the equation: SWE = aPDO + bPNA + cNP + d is also given. All coefficients which have a p < 0.05 are marked in bold.
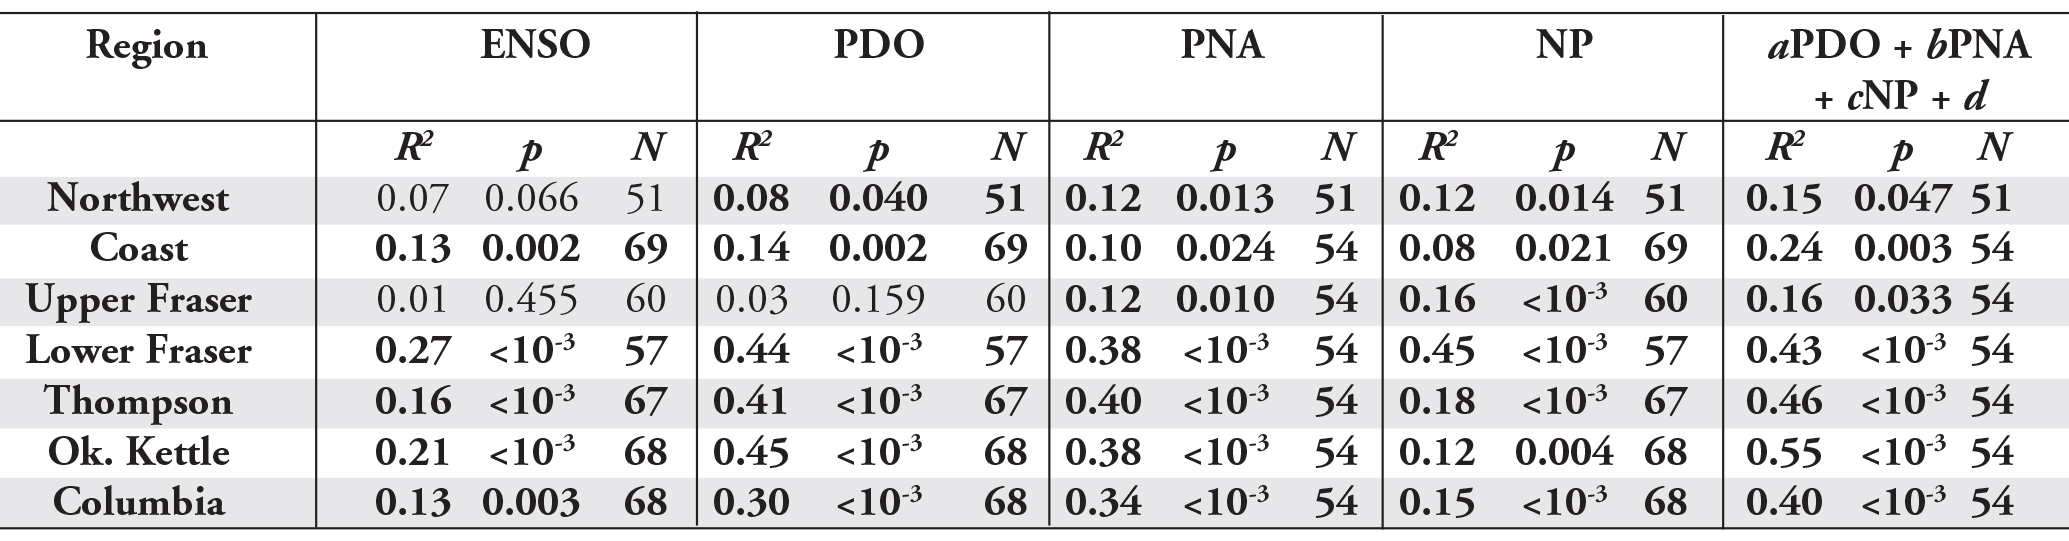
The first thing you’ll notice is an increased number of significant correlations and overall stronger correlations for April 1st SWE (Table 4) than for February 1st SWE (Table 3). Again, PDO, PNA and NP outperformed ENSO in terms of predictive merit. These three indices were, again, combined for regression analysis. By combining these three indices the amount of variability explained by the linear trends was improved for all regions except the Upper and Lower Fraser regions where NP did a better job alone.
Table 4 – Squared Pearson linear correlation coefficients (R2) for the correlations between April 1st regionally averaged SWE and each of the four climatic indices. The coefficient of multiple determination (R2) for the equation: SWE = aPDO + bPNA + cNP + d is also given. All coefficients which have a p < 0.05 are marked in bold.
Top Five Sites
The top five performing snow survey sites, in no particular order, are: McBride in the Upper Fraser region; Blue River in the Thompson region; Fidelity Mountain in the Columbia region, Sullivan Mine in the Columbia region; and Fernie East in the Columbia region (Tables 5 and 6). ENSO has once again dropped the ball, PDO, PNA and NP, however, look promising (Tables 5 and 6). Again, the correlations with April 1st SWE were stronger than those with February 1st SWE for all sites and all correlations with ENSO and NP are positive, while PDO and PNA consistently show negative relationships with SWE. Once again, a combination of PDO, PNA and NP did a better job of predicting February 1st (Table 5) and April 1st (Table 6) SWE than any of
the indices alone.
Table 5 – Squared Pearson linear correlation coefficients (R2) for the correlations between February 1st SWE for the top five performing snow survey sites and each of the four climatic indices. The coefficient of multiple determination (R2) for the equation: SWE = aPDO + bPNA + cNP + d is also given. All coefficients which have a p < 0.05 are marked in bold.
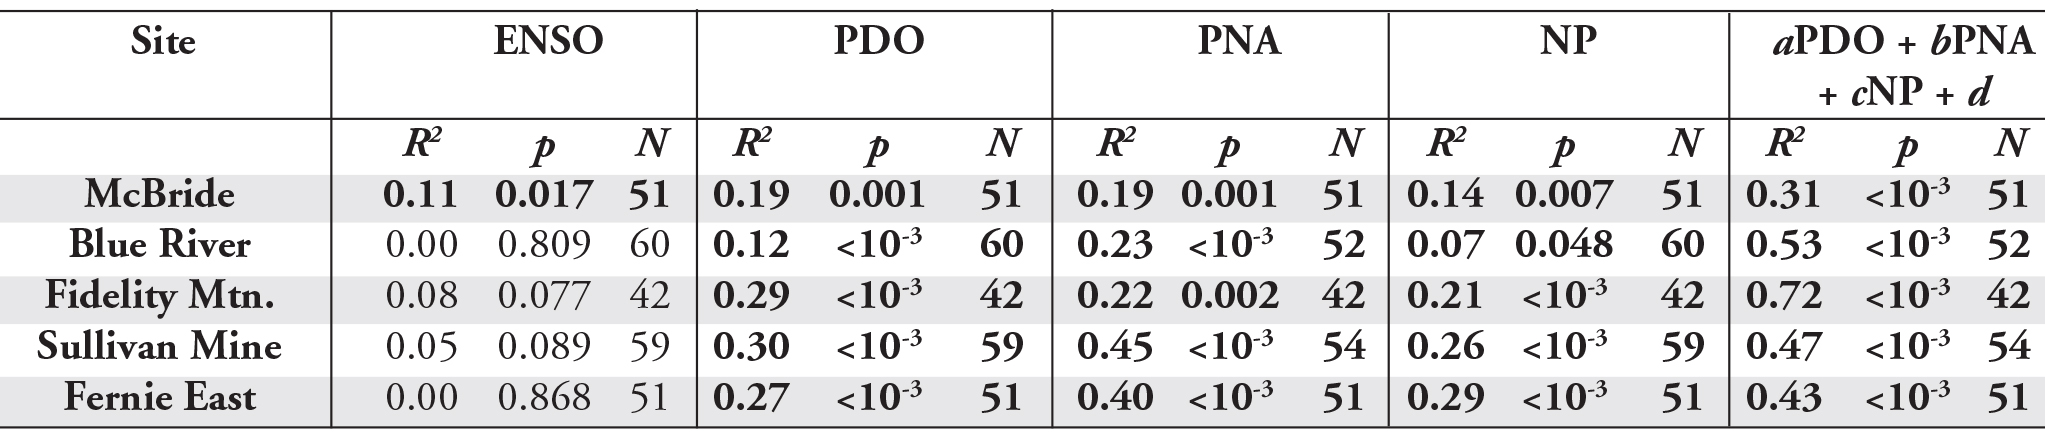
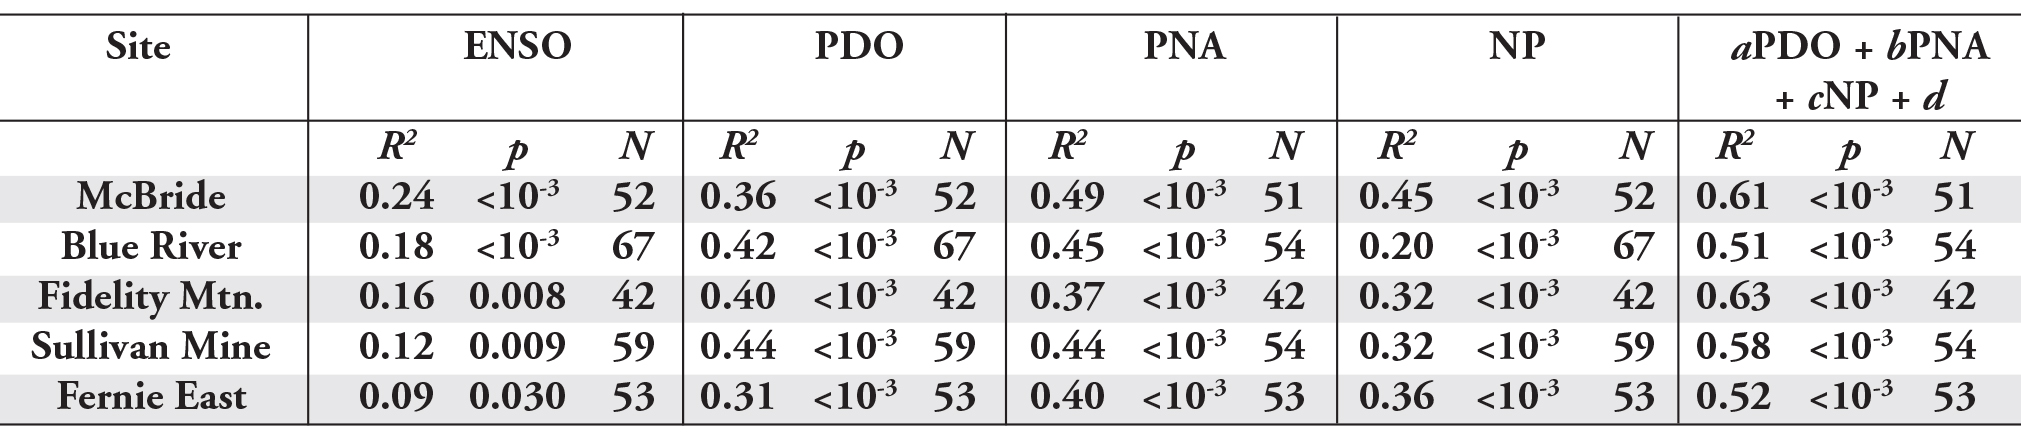
Table 6 – Squared Pearson linear correlation coefficients (R2) for the correlations between April 1st SWE for the top five performing snow survey sites and each of the four climatic indices. The coefficient of multiple determination (R2) for the equation: SWE = aPDO + bPNA + cNP + d is also given. All coefficients which have a p < 0.05 are marked in bold.
Discussion
The bottom line is: do not rely on ENSO to predict the snowpack depth in the winter to come. The other three indices (PDO, PNA and NP) either alone or combined do a much better job of predicting both February 1st and April 1st SWE at the provincial, regional and individual site scales. Overall, April 1st SWE showed better correlations than February 1st SWE with all four climatic indices. For the most part a combination of PDO, PNA and NP indices will give you the best indication of the winter and spring snowpack to come. For the Upper or Lower Fraser regions in April, your best bet is with NP. Finally, if you like to ski in the Columbia region in February, it’s PNA all the way.
What about the effects of climate change? Well, certainly as our climate continues to change at an accelerated rate, the use of historical climatic data to predict the future becomes less valid. Most climate change models (and there are many) agree that as our climate continues to change, we are going to see more extreme weather patterns. The good news is this means more epic winters like 1999. The bad news is we’ll also see more winters like last year and yes, I realize that it was only extremely bad on the coast. But now that we have these new prediction tools under our proverbial belts we can better decide in the fall whether to buy a new pair of fat boards or spend the money on airfare to South America.
Outlook for next winter? Well, I hesitate to make any predictions because things aren’t looking good and I don’t want to be the bearer of bad news. As of June 2005 the PDO and PNA indices were in a strong positive phase while the NP index was weak, and remember PDO and PNA are negatively correlated with SWE while NP is positively correlated. Anyone interested in a climbing trip to Chile?
Acknowledgements
I would like to thank Dr. Bruce Jamieson for proofreading this article and for providing statistical expertise. I would also like to acknowledge Dr. Dan Moore for providing the idea and proofreading the original draft of this article.
References
Cayan, D.R., and D. H. Peterson. 1989. The influence of North Pacific atmospheric circulation on streamflow in the west. Aspects of Climate Variability in the Pacific and Western Americas, Geophys. Monogr. Ser., 55, 375- 397.
Cayan, D.R., and R. H. Webb. 1992. El Niño/Southern Oscillation and streamflow in the western United States . El Niño: Historical and Paleoclimatic Aspects of the Southern Oscillation. Cambridge University Press, New York, USA. pp.29-68.
Chagnon, D., T. B. McKee and N. J. Doesken. 1993. Annual snowpack patterns across the Rockies: Long-term trends and associated 500-mb synoptic patterns. Mon. Wea. Rev., 121, 633-647.
Dracup, J.A. and E. Kahya. 1994. The relationships between U.S. streamflow and La Niña events. Wat. Resour. Res, 30, 2133-2141.
Koch, R.W., C. F. Buzzard and D. M. Johnson. 1991. Variation of snow water equivalent and streamflow in relation to El Niño/Southern Oscillation. Proceedings of the1991 Western Snow Conference, April 12-15, Juneau, U.S.A. pp. 37-48.
Mason, S. J. and L. Goddard. 2001. Probabilistic precipitation anomalies associated with ENSO. Bull. Amer. Meteor. Soc., 82, 619–638.
McCabe, D. J. Jr. 1994. Relationships between atmospheric circulation and snowpack in the Gunnison River basin, Colorado. J. Hydrol., 157, 157-175.
Moore, R. D. and M. N. Demuth. 2001. Mass balance and streamflow variability at Place Glacier, Canada, in relation to recent climate fluctuations. Hydrol. Processes, 15: 0-0 (2001).
Moore, R. D. and I. G. McKendry. 1996. Spring snowpack anomaly patterns and winter climatic variability, British Columbia, Canada. Wat. Resour. Res, 32, 623-632.
Patten, J. M., S. R. Smith and J. J. O’Brien. 2003. Impacts of ENSO on snowfall frequencies in the United States. Bull. Amer. Meteor.Soc., 18, 965–980.
Redmond, K. T. and R. W. Koch. 1991. Surface climate and streamfl ow variability in the western United States and their relationship to large-scale circulation indices. Wat. Resour. Res, 27, 2381-2399.
Ropelewski, C. F. and M. S. Halpert. 1996. Quantifying Southern Oscillation–precipitation relationships. J. Climate, 9, 1043– 1059.
Renwick, J. A. and J. M. Wallace. 1996. Relationships between North Pacifi c wintertime blocking, El Niño, and the PNA pattern. Mon. Wea. Rev., 124, 2071-2076.
Sittel, M. 1994. Differences in the means of ENSO extremes for maximum temperature and precipitation in the United States. Center for Ocean–Atmospheric Prediction Studies Tech. Rep. 94-2, Florida State University, 50 pp.
Smith, S. R. and J. J. O’Brien. 2001. Regional snowfall distributions associated with ENSO: Implications for seasonal forecasting. Bull. Amer. Meteor. Soc., 82, 1179–1191.
Trenberth, K. E. and J. W. Hurrell. 1994. Decadal atmosphere-ocean variations in the Pacifi c. Clim. Dynam., 9,303-319.
Yarnal, B. and H. Diaz. 1986. Relationships between extremes of the Southern Oscillation and the winter climate of the Anglo–American Pacific coast. J. Climatol., 6, 197–219.
Zhang, Y., J. M. Wallace and D. S. Battisti. 1997. ENSO-like interdecadal variability: 1900-93. J. Climate, 10, 1004-1020.
Tags:
avalanche journal
cam campbell
el nino
enso
snowpack depth
Permalink
| Comments (0)
|
|
|
Posted By Alex Cooper, Canadian Avalanche Association,
January 29, 2020
|
From volume 96, spring 2011
By Bruce Jamieson, Dept. of Civil Engineering, Dept. of Geoscience, University of Calgary, Calgary AB, Canada
Jürg Schweizer, WSL Institute for Snow and Avalanche Research SLF, Davos, Switzerland
Grant Statham, Parks Canada Agency, Banff AB, Canada
Pascal Haegeli, Avisualanche Consulting and Simon Fraser University, Vancouver BC, Canada
ABSTRACT
At the 2004 ISSW, Roger Atkins proposed that—early in the terrain selection process—backcountry travellers could identify which types of avalanches were likely, e.g. wind slab, persistent slab, wet avalanche. These avalanche types are analogous to a set of scenarios in traditional risk analysis. Variations on Atkins’ approach have been incorporated into some public bulletins. The types of avalanches that dominate the danger ratings are called Avalanche Types/Characters/Threats/Concerns/Situations/Problems by different groups. The latest Swiss brochure for recreation in avalanche terrain suggests different observations for the four different types of avalanche situations. To help determine which observations are best for which types of avalanches, a field study was conducted in the winters of 2008-09 and 2009-10 in the Coast Mountains, Columbia Mountains, and Rocky Mountains of western Canada. On each field day, an experienced field team rated the local avalanche danger, identified two dominant avalanche types and observed a standard set of over 20 quick field observations. The quick observations included avalanches, wind transported snow, snowfall, etc. For correlation analysis, we focussed on two distinct classes of avalanche types: 1) persistent slabs, and 2) wind slabs combined with storm slabs. While some observations correlated with the local danger when either class of avalanches dominated the danger rating, other observations correlated best when only one of these two classes dominated the local danger rating. These results may help bulletin writers recommend that recreationists focus on certain local observations for better informed decisions.
INTRODUCTION
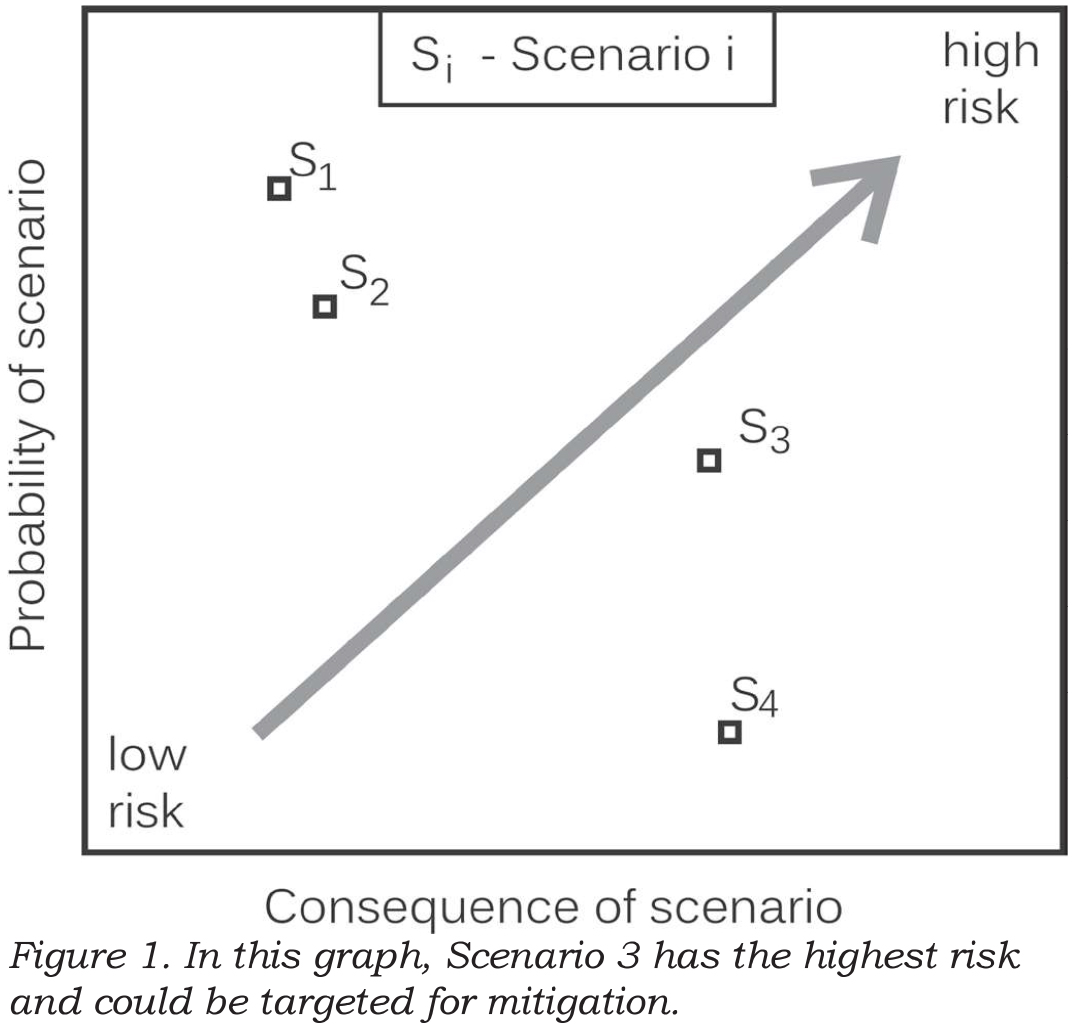
For decades, risk analysts for natural hazards have identified distinct scenarios (or potential events) which threaten something of value e.g. property or infrastructure. For each scenario, the probability of the natural event affecting the thing of value and the expected consequences are estimated (Kaplan and Garrick, 1981). Mitigation, if required, typically focuses on the scenarios with the highest risk (combination of probability and consequences). If the probability and consequences for each scenario can be quantified, the risk for the can be graphed as in Figure 1. If either the probability or consequence can only be ranked (not quantified), the scenarios are usually presented in a risk matrix (e.g. Ahrens, 2008, p. 22-24). The scenarios with the highest risk (or unacceptable risk) can be targeted for mitigation. This established approach to risk analysis has been used for long-return period avalanches that can affect property (e.g. Wilhelm, 1998). The same concept is also used informally by guides, forecasters and experienced recreationists, who often focus on one or two types of avalanches (scenarios) when assessing the risk on the terrain being considered for the current day.
For many years some Swiss guides and avalanche educators have proposed asking: “What is the main danger today?” On most days, it can be decided whether it is either a New Snow, and Old Snow, or a Wet Snow situation.
Once the situation is recognized, the mitigation strategy can be adapted (Wassermann and Wicky, 2003). Stephan Harvey has further formalized this approach, called it pattern recognition and added one more situation: Wind Driven Snow, when an increased avalanche danger often prevails (Harvey, 2008).
In parallel with the Swiss development of Avalanche Situations, at the 2004 ISSW in Jackson Hole, Roger Atkins proposed that the probability and consequences be assessed separately for different types of avalanches, e.g. wind slab, persistent slab, wet avalanche, so the decision makers could focus on the one or two scenarios (Avalanche Types) that posed the greatest risk. Some of his avalanche characteristics incorporated terrain, e.g. wind slabs near ridge tops.
Atkins’ concept was used by the Avalanche Danger Scale Project, which was a Canada-US part of the multi-agency project called Avalanche Decision Framework for Amateur Recreationists 2 (ADFAR2). Starting in 2005, the committee of mostly forecasters took a fresh look—actually fresh look after fresh look—at the forecasting process. When they finally had a consensus, the Avalanche Type was a key component of their conceptual forecasting model (Statham et al., 2010). Definitions for the different types of avalanches have been developed. These definitions were the basis for incorporating Avalanche Problems into Canadian avalanche bulletins (Klassen, 2010).
Most recently, Avalanche Type been used as the central theme in a field book for decision-making in avalanche terrain published by the Canadian Avalanche Centre (Klassen et al., 2010). The field book contains templates for recording the relevant observations and facilitates decisions when preparing for and travelling in avalanche terrain.
The concept of Avalanche Type has been and will continue to be applied at various scales. At the slope scale, experienced forecasters and guides can visualize certain types of potential avalanches on the terrain. At the regional scale, some avalanche forecast centres have started to use one, two, or occasionally three Avalanche Types in their public bulletins. Although there is as yet no consistent terminology (Table 1), the concept has caught on and is now used in various applications.
When updating the popular Swiss avalanche awareness brochure “Caution – Avalanches!” the idea of Avalanche Situations was merged with the reduction method with the classical 3x3 framework (Harvey et al., 2009). For each of the four Avalanche Situations, a number of key observations are proposed to help recreationists focus on the most important observations for the day (Table 2).
Early experience with this scheme suggests that on some days it is difficult to distinguish between new snow and wind driven snow. Also, the debate continues about whether to explicitly recommend digging when old snow is the dominant avalanche situation. On the other hand, the emphasis is not on digging when either new snow, wind driven snow or wet snow is the primary avalanche situation.
The relevant observations for each Avalanche Type in Table 2 are based on experience and an understanding of the processes that form the different types of potential avalanches. Haegeli and Atkins (2010) also present key observations from a survey of experienced avalanche professionals. For this study, we set out to use field data (independent of theory or experience) to identify some key observations when different types of avalanches were dominating the danger rating.

METHODS AND DATA
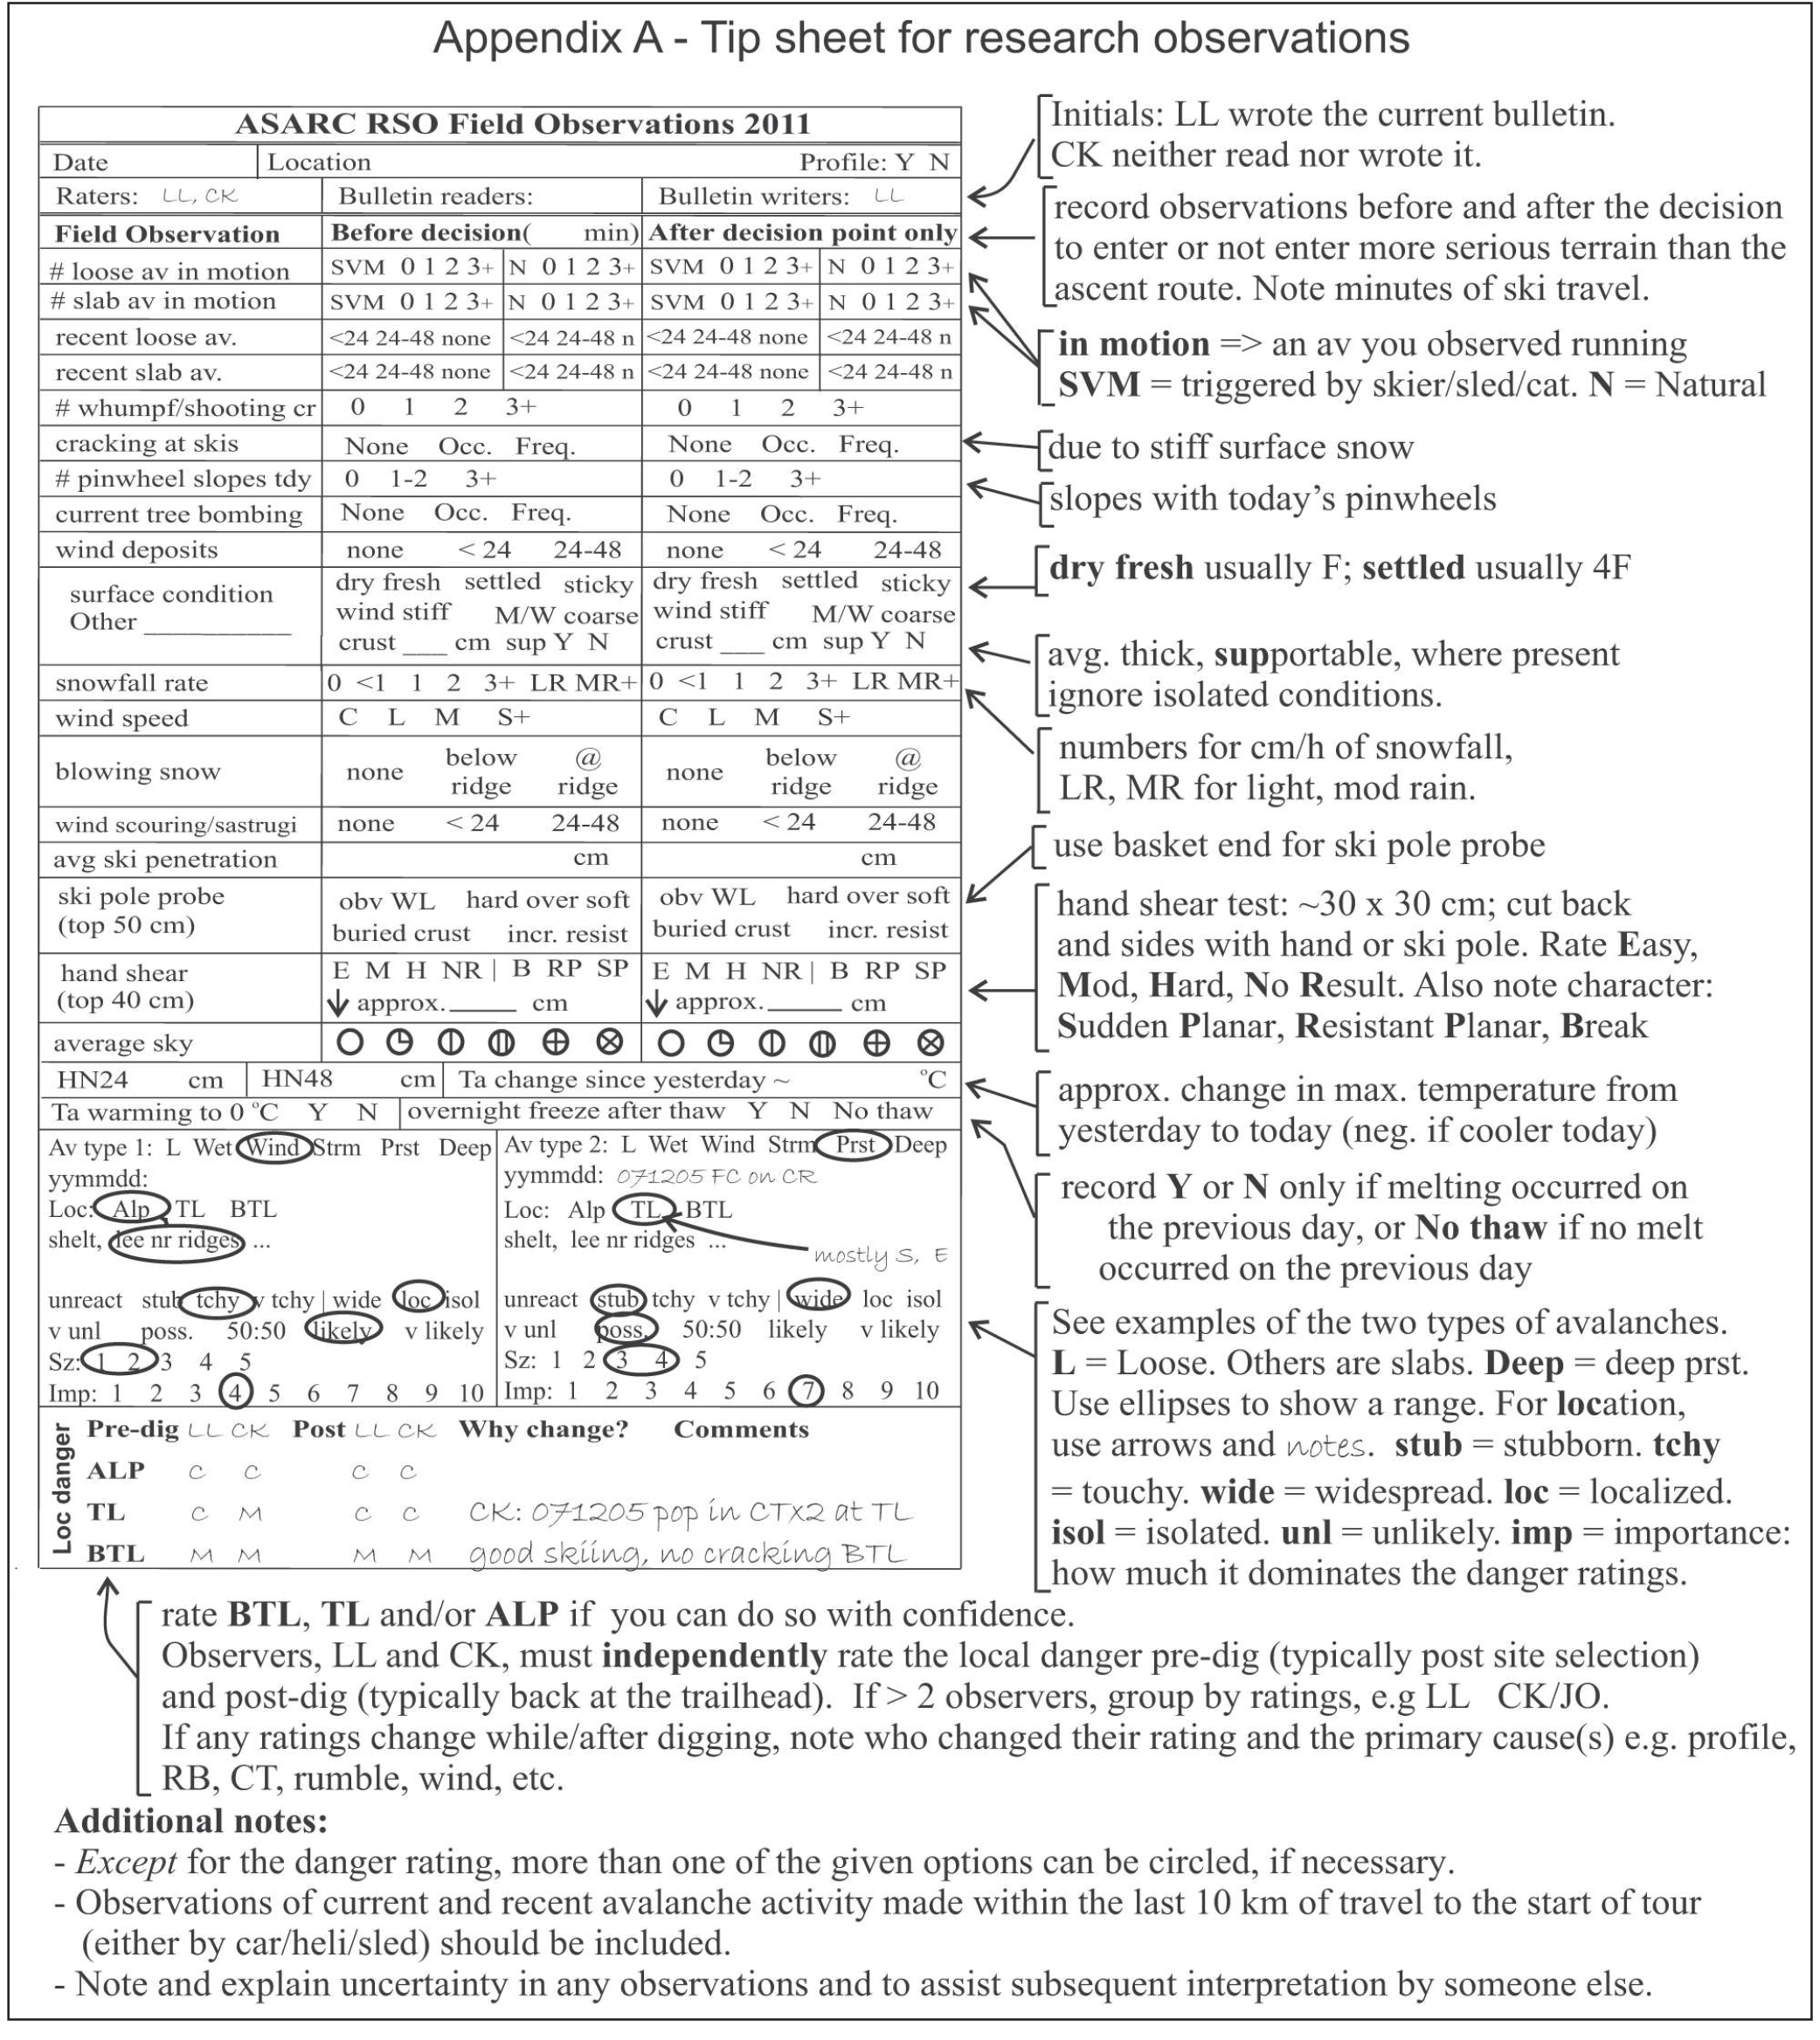
Since the winter of 2007, the Applied Snow and Avalanche Research group at the University of Calgary (ASARC) has been rating the local avalanche danger and making a standard set of over 20 observations (e.g. Jamieson and Haegeli, 2008; Appendix A). Starting in the winter of 2009, we began daily rating the top two Avalanche Types so we could assess which observations were “best” for the various types of expected avalanches. This paper summarizes the results from the winters of 2008-09 and 2009-10.
On most field days in the winters of 2008-09 and 2009-10, ASARC’s field teams in the Coast Range, Columbia Mountains and Rocky Mountains rated the local avalanche danger, made over 20 standard observations (Appendix A), and identified the two most important Avalanche Types (Table 1). For this study we used only the Avalanche Type with the greatest importance—based on its contribution to the danger rating. If the two avalanche types had equal importance (50:50), we used the one recorded as Avalanche Type 1.
Many of the observations were made before and after the decision point, i.e. when the team reached treeline. For each observation, e.g. blowing snow, we used the before or after observation that was more conducive to higher avalanche danger. So, if we observed blowing snow in the morning but not in the afternoon, we used the morning observation.
For most of the observation variables, the specific observation values could be ordered from the least associated with avalanching to the most. For example, the observations for blowing snow were ordered: none, at ridge, below ridge.
Appendix A shows that we rated the local danger for one, two or three elevation zones: below treeline, treeline and alpine. We used the treeline rating, except in four cases in which we did not rate the local avalanche danger at treeline, in which case we used the below treeline rating.
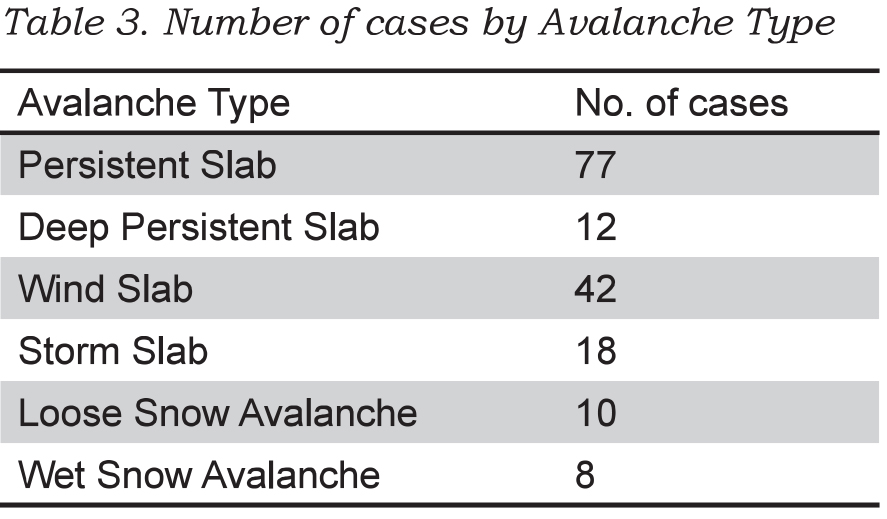
In a few cases in which the precipitation was rain, we treated the precipitation rate as missing. This resulted in the dataset shown in Table 3. Each case is a record of one field team travelling on touring skis in a specific area on a given day.
We excluded Loose Avalanche and Wet Avalanche types from the analysis since there were too few cases. Also because of limited cases, we combined Storm Slab with Wind Slab, and combined Deep Persistent Slab with Persistent Slab.
PRELIMINARY RESULTS
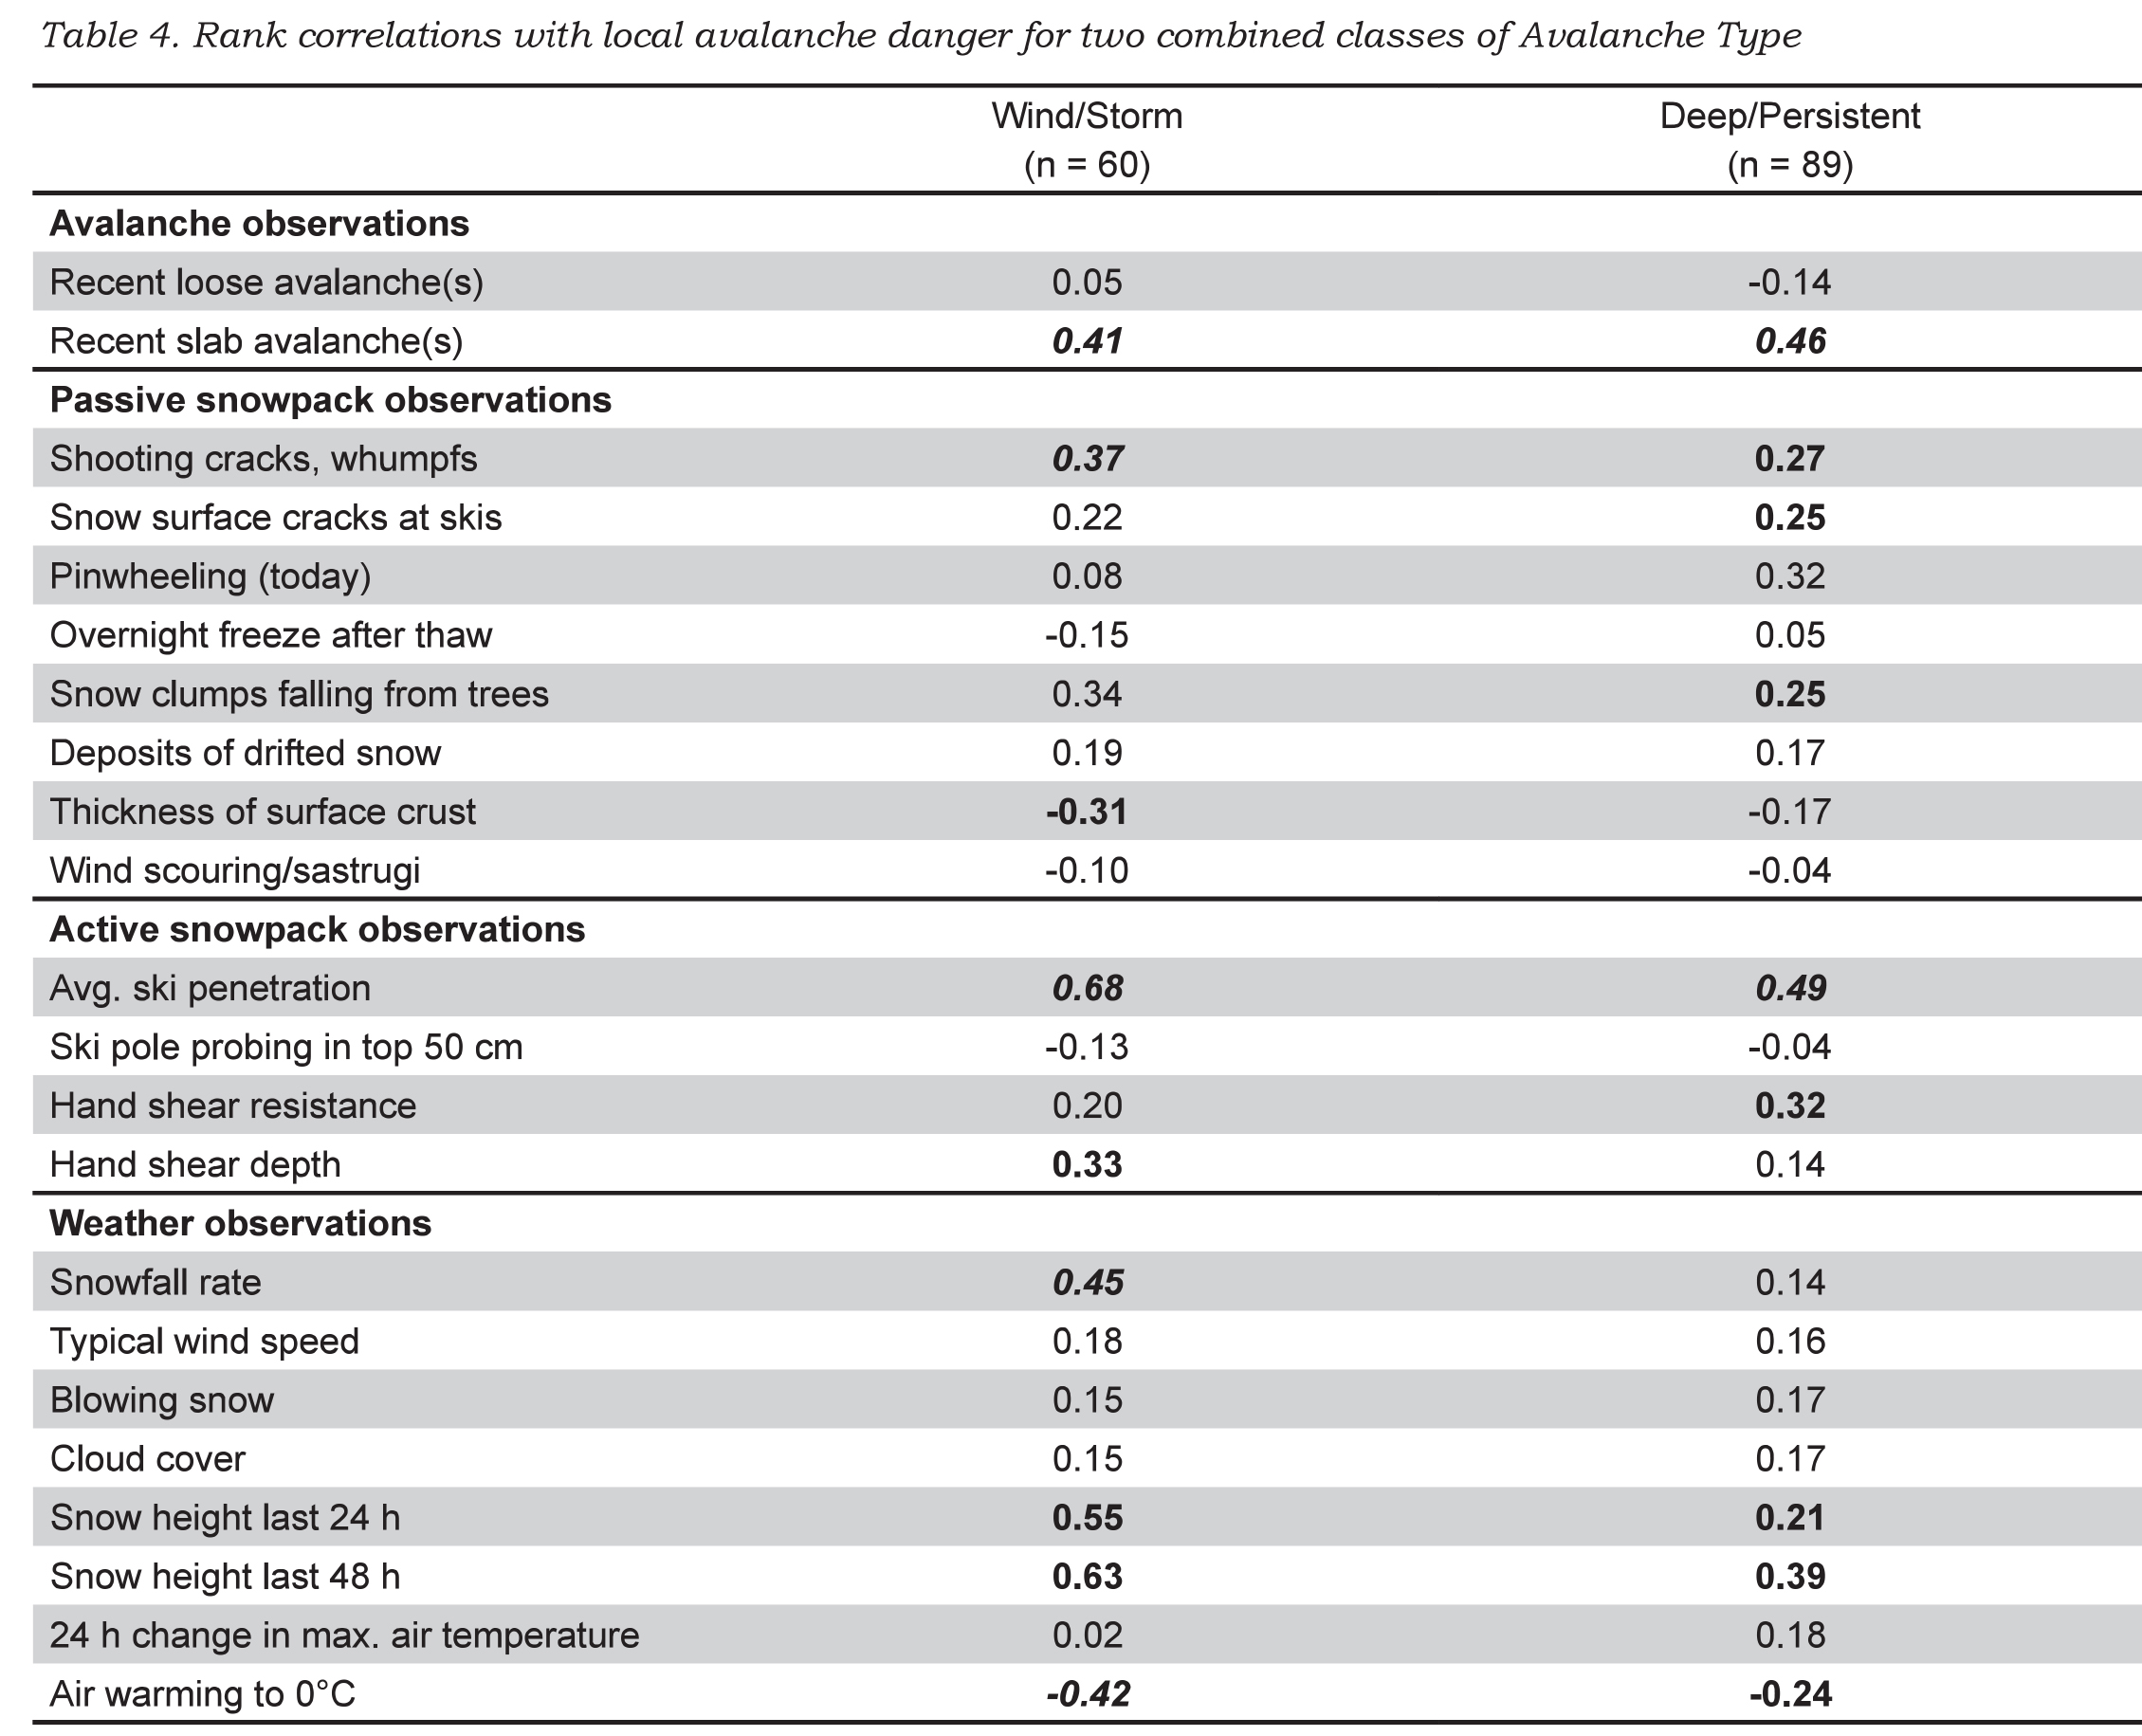
Spearman rank correlations between the local danger rating and the ordered observations are shown in Table 4. Correlations for which p < 0.05 are marked in bold. Correlations for which p < 0.01 are marked in bold italic.
Observations that correlated when either class of Avalanche Type was important?
When either Wind Slab/Storm Slab Avalanches or Deep/Persistent slab avalanches dominated the danger rating, the observations that correlated with the local avalanche danger were: slab avalanches, whumpfs/shooting cracks, clumps of snow falling off trees (tree bombs), deep ski penetration, snow height (snowfall) from in last 24/48 h, and air warming to 0°C (negative) (Table 4). The negative correlation prompted a second look at the data: when the air temperature reached 0°C (usually spring time), the avalanche danger was mostly Low or Moderate.
Observations that correlated when storm snow or wind slabs were important?
In addition to the observations mentioned in the previous paragraph, the snowfall rate, increased hand shear depth and absence of a surface melt-freeze crust correlated with the local avalanche danger when storm snow or wind slabs dominated the danger rating (Table 4). The key variables include the following observations of current or recent snowfall: snowfall rate, accumulated snowfall in the last 24/48 hours, as well as deep ski penetration.
Observations that correlated when deep/persistent slab avalanches were important?
In addition to the observations mentioned for both classes of Avalanche Types, low hand shear resistance, pinwheeling, and snow surface cracking at skis correlated with the local avalanche danger when Deep/Persistent Slab Avalanches dominated the local danger rating.
DISCUSSION
The observations proposed by the Swiss avalanche awareness brochure Caution – Avalanches! (Harvey et al., 2009) and the Canadian Avalanche Centre field book (Klassen et al., 2010) are supported by the correlations in Table 4. For a New Snow Avalanche Situation, recent slab avalanches and new snow amount correlated with the local avalanche danger. For an Old Snow Avalanche Situation, whumpfs correlated with the local avalanche danger. Some correlations, such as the one between pinwheeling and the local danger when Deep/Persistent Slabs are important, are difficult to explain and may not be significant in a larger, more balanced dataset.
For Deep/Persistent Slabs, fewer observations correlated with local danger than for Storm Snow and Wind Slab Avalanches, which is consistent with the greater forecasting challenge for persistent slabs. See also the limited relevant observations in Table 2 for the Old Snow Avalanche Situation.
Research often yields unexpected results. When ASARC’s morning stability evaluation was expanded to include identification of the one or two most important Avalanche Types, one of us (Jamieson) expected the usual response to increased paperwork. Instead, the field staff liked the focus that Avalanche Type provided to the morning safety meeting and has retained it. The Avalanche Type is just one part of the rethinking of the forecasting (Statham et al., 2010) that has become popular with ASARC’s field staff.
SUMMARY
Several regional forecast centres have adopted the concept of Avalanche Character/Type/Threat/Concern/Situation/Problem for use in their public bulletins. This concept is consistent with the scenarios in traditional risk analysis. Harvey (2008) has proposed specific observations for certain classes of Avalanche Situations. For this study, we analysed a dataset of 159 cases (locationdays) in which over 20 observations were made and the local avalanche danger was rated. When the dominant Avalanche Type was either Storm Avalanches or Wind Slabs, the observations that correlated (and were consistent with knowledge of avalanche formation) included recent slab avalanches, snowfall rate, snow clumps falling from trees (usually indicative of wind or warming), deep ski penetration and snow height from the last 24/48 hours. When the dominant Avalanche Type was either Deep Persistent or Persistent Slab, the observations that correlated (and made sense) included recent slab avalanches, whumpfs/shooting cracks, deep ski penetration and increased snow height from the last 24/48 hours.
Further field studies are planned. There are other observations that correlated in this study and may benefit from analysis of a larger dataset. However, any recommended observations should be consistent with the current understanding of the processes that form the different types of avalanches.
ACKNOWLEDGEMENTS
For the careful field work we are grateful to Cam Campbell, Spencer Krkosky, Deanna Andersen, Lydia Marmont, Peter Marshall, Chris Geisler, Ali Haeri, Cameron Ross, Thomas Exner, Mark Kolasinski, Katherine Johnston, Cora Shea, Mike Smith, Dave Tracz and Jordan Stiefvater. Thanks also to Mike Smith for proofreading, to Cameron Ross for checking the data and Dave Gauthier for checking the analysis.
For logistical support for the field studies we thank Mike Wiegele Helicopter Skiing, BC Ministry of Transportation and Infrastructure, BC Ministry of Parks, Parks Canada, the Canadian Avalanche Centre, as well as the Avalanche Control Section of Glacier National Park.
For financial support for the field studies and the first author’s time, we thank the Natural Sciences and Engineering Research Council of Canada, HeliCat Canada, the Canadian Avalanche Association, Mike Wiegele Helicopter Skiing, Teck Mining Company, Canada West Ski Areas Association, the Association of Canadian Mountain Guides, Backcountry Lodges of British Columbia, and the Canadian Ski Guides Association.
REFERENCES
Ahrens, T. 2008. Risk Analysis. John Wiley & Sons, Chichester, England.
Atkins, R. 2004. An avalanche characterization checklist for backcountry travel decisions. Proceedings of the 2004 International Snow Science Workshop in Jackson Hole, Wyoming, USA, 462-468.
Haegeli, P., Atkins, R. 2010. Exploring the ‘It depends’ – How do mountain guides assess avalanche situations? In Osterhuber,
R. and Ferrari, M. (eds.), Proceedings of the 2010 International Snow Science Workshop in Squaw Valley, California, USA, 130-132.
Harvey, S. 2008. Mustererkennung in der Lawinenkunde. In: I. Kroath (Editor), Sicherheit im Bergland. Oesterreichisches Kuratorium für Alpine Sicherheit, Innsbruck, Austria, pp. 88-94.
Harvey, S., Schweizer, J., Rhyner, H., Nigg, P., Hasler, B. 2009. Caution - Avalanches! 6th edition. Avalanche Prevention in Snow Sports, Core team of instructors, Davos, Switzerland.
Jamieson, B., Haegeli, P. 2008. Can field observations be combined systematically with the regional danger rating to estimate the local avalanche danger? Proceedings of the 2008 International Snow Science Workshop in Whistler, BC, 228-237.
Kaplan, S., Garrick, B.J. 1981. On the quantitative definition of risk. Risk Analysis 1(1), 11-21.
Klassen. K. 2010. The Avalanche Hazard Assessment Web-tool – A structured approach to public avalanche forecasting. Presentation at the Spring Conference of the Canadian Avalanche Association, 6-7 May 2010.
Haegeli, P., Atkins, R., Klassen, K. 2010. Decision Making in Avalanche Terrain. Canadian Avalanche Centre, Revelstoke, BC, 62 pp.
Statham, G., Haegeli, P., Birkeland, K., Greene, E., Israelson, C., Tremper, B., Stethem, C., McMahon, B., White, B., Kelly, J. 2010. In Osterhuber, R. and Ferrari, M. (eds.), A conceptual model of avalanche hazard. Proceedings of the 2010 International Snow Science Workshop in Squaw Valley, California, USA, 686.
Wassermann, E., Wicky, E. 2003. Lawinen und Risikomanagement. Edition Filidor, Reichenbach, Switzerland, 60 pp.
Wilhelm, C. 1998. Quantitative risk analysis for evaluation of avalanche protection projects. In Hestnes, E., ed. Proceedings of the Anniversary Conference 25 Years of Snow Avalanche Research, Voss, 12-16 May 1998. Oslo, Norwegian Geotechnical Institute, Publication 203, 288-293
Tags:
avalanche journal
avalanche observations
avalanche research
avalanche types
snowpack tests
Permalink
| Comments (0)
|
|
|
Posted By Alex Cooper, Canadian Avalanche Association,
January 22, 2020
|
From vol. 106, spring 2014
By Paul Cordy

DEPOSIT FROM PATH 19.3 IN KOOTENAY PASS. A SIZE 3 AVALANCHE TRIGGERED BY HELI BOMBING // MOTI
IN THE WORLD OF BIG DATA we have become accustomed to interacting with computer models. The search for good snow inevitably begins by consulting the ensemble weather forecast (the consensus weather prediction of five different detailed models of the atmosphere), just as most searches for knowledge these days begin by consulting Google (a complex and dynamic model of the relevance of digital information). So one might expect that any day now Big Data will begin to spread its tentacles into the world of avalanche safety. But are there particular challenges to using computer models for avalanche prediction? Not the least of these may be thecomplexity of geographic and human factors leading to avalanche formation, and also the scarcity of reliable and continuous information about conditions in the start zones.
So how far have avalanche prediction models come, and how might they benefit organizations and individuals? Will they ever be good enough to rely on in Canada? The British Columbia Ministry of Transportation and Infrastructure (MOTI) has a long history of taking the lead in creating digital tools for avalanche practitioners. These efforts have led to the development of one tool that we know and use already: SnowPro. A lesser-known innovation of the MOTI is the computer-based avalanche forecasting system which began more than 15 years ago in Kootenay Pass. Ted Wieck, former information systems manager for the MOTI avalanche and weather branch, spent over a decade developing the MOTI’s first digital highway, weather, and avalanche database. In the beginning, this meant considerable amounts of tedious data entry for technicians, who would have rather spent more time in the hills and on the road. Ted wanted to make all that data useful to the people who were assiduously collecting it for him, and so he became a fervent supporter of computer-based avalanche prediction.
In the mid-nineties, Dr. David McClung and John Tweedy developed and tested software that used manual weather observations (input by the user, of course) to predict the probability of avalanche activity that day. The prediction was based on a statistical model that was created using historical weather data and avalanche occurrence records from the previous ten seasons at Kootenay Pass. As in all computer models (including Google’s search engine), historic data is used to train the model, or in the case of MOTI, determine the relative importance of various weather variables and how to combine them in a way that computes accurate predictions of avalanches.
This is not too dissimilar to the way that we humans learn. Our experience is combined with training to create mental models of how weather creates avalanches. Often we will compare current weather or snowpack structure with previous seasons’ observations to refine our decisions. The original Kootenay Pass model also retrieved the ten most similar instances of weather and presented the data to the human forecaster to further aid in decision making. In the end, both model approaches were 70-80% accurate. Early in the 2000s, James Floyer proved that similar models could be trained on Bear Pass datasets with similar results.

A CROWN ON PATH 19.8, KOOTENAY PASS // MOTI
As a Masters student with McClung at the University of British Columbia, my contribution to this effort was to dynamically integrate numerical weather forecasts and optimize different versions of the model for each of five different highway corridors with active avalanche control programs. In each place, we used ensemble weather forecasts up to 48 hours ahead into each model, thus extending avalanche predictions into the future (all previous avalanche models predicted present probability of avalanches only). As it happens, predicting avalanches in the future mostly depends on the accuracy of weather forecasting, and most avalanche forecasting models achieve similar accuracy irrespective of the type or complexity of the model.
Of course a 70 to 80% prediction rate is horribly inaccurate given the consequences range from traffic hazard to loss of life, and so there always had to be a human forecaster calling the shots. But before dismissing computer models, one must consider the constraints under which they are working.
Take weather forecasting as an analogy. European weather prediction is far better than that of western North America because of differences in density of meteorological stations. Weather systems en route to Europe are being broadcast by countless sensors in myriad islands and land masses in the Atlantic, not to mention by the North American sensor network. Reliable data makes for more reliable weather models. By contrast, weather on its way to western North America passes over the Pacific Data Void, a vast stretch of ocean almost uninterrupted by islands and permanent weather stations. So the very same computer models are often inaccurate more than 24 hours in advance.
So too with computer models of avalanche prediction. Greater complexity and precision of avalanche models is unlikely to improve forecast accuracy until we provide such models with more and better information. The data that we provide prediction models couldn’t possibly compete with the human experience. Avalanche technicians explore the terrain, doing hand shears and listening to the snow settling under their skis. They feel temperature changes when fronts come through, just like the sensor networks do, but sensors can’t see the sun hit certain start zones, and they can’t see how snow is loading up there. Really, it’s a miracle that numerical prediction algorithms are accurate at all.
Therefore, the next goal was to integrate information about the snowpack into the model. The MOTI avalanche models had a built-in mechanism for updating the avalanche probabilities based on new information. Previously, this "prior" information was added by the forecaster in response to avalanche control results or other knowledge that was not available to the model. Prior probabilities could just as easily come from a model of snowpack structure and stability such as the red flag method of SnowPro, or the SNOWPACK physical model used in Switzerland. Unfortunately, changing funding priorities and personnel at the MOTI meant that snowpack information was never integrated into predictions, although it is still used in Kootenay Pass. It’s up to the next generation take it to another level.
NORTH FORK AVALANCHE AREA ON THE EAST SIDE OF KOOTENAY PASS // MOTI
Generational change itself was also a major driver of interest in creating the model. During the latest bout of modeling studies, MOTI was facing the near-simultaneous retirement of all of their technicians. MOTI saw that new staff might get up to speed more quickly if they could scan the results for the size, type and spatial distribution of natural or controlled avalanches in the historical records. The idea was to try to decouple the memories of seasons from the people who observe them, and help bridge the loss of team experience when seasoned professionals retire. Furthermore, the benefits of such systems would be more apparent to successive generations of technicians who would be ever more native to the digital environment. Whereas the old ironsides of the avalanche patch are more likely to decry that their Rite in the Rain books have never crashed nor printed error messages, younger generations are more likely to wish they could just use their iPhone and store it in the cloud.
Computers can supplement our memories, help us see broad patterns, and evaluate the importance of various causal factors that govern avalanche formation. Snowpack depths and precipitation intensity can be measured by satellite, and soon we’ll have satellites sensing atmospheric structure and conditions over the Pacific Data Void. With more and more wired backcountry users and the Canadian Avalanche Centre’s geo-referenced recreationist observation database, avalanche information is set to explode. Models can help us to synthesize an oversupply of data into relevant knowledge. That knowledge will always be limited by the data and model that generate it, and may always require a human to make life and death decisions. However with changing personnel and changing climate, it helps to maintain historical perspective on present events. Avalanche prediction models can help to bridge present and past, and to help us tease out the most relevant information that can be used to manage risk.
As the analytical techniques of Big Data inexorably penetrate all aspects of life, I expect that one day they will be as much a part of the furniture of our lives as smartphones. However, research and development in avalanche risk modeling advances through the vision, passion and forward thinking of people like John Tweedy and Ted Weick, who championed the initiative within the MOTI. Although my main research focus has shifted from avalanche models to pollution modeling and mitigation, I maintain a deep interest in the topic. As we approach the critical information density with respect to snow and weather, I look forward to collaborating with the next generation of visionaries and institutional champions that will bring the avalanche world back in step with Big Data.
Tags:
avalanche control
avalanche journal
avalanche prediction
kootenay pass
ministry of transportation
modeling
MOTI
Paul Cordy
Permalink
| Comments (0)
|
|
|
Posted By Alex Cooper, Canadian Avalanche Association,
December 11, 2019
|
From Vol. 101, fall 2012
By Rod Gee
Glide slab explosives control results, 50 mile path. Skeena River corridor, west of Terrace, BC. By Rod Gee
My twenty-five year glide slab education began on an early morning in January 1989. A snowplow operator on Highway 16 west of Terrace reported witnessing a Size 3.5 airborne wet avalanche cross the railroad and highway corridors.
The deposit pushed sections of concrete guardrail into the Skeena River. Fortunately, no one was involved. I arrived at the site shortly after hearing the plow operator’s report. “Argh! It’s the glide slab I’ve been monitoring for the last week," I thought; "Why this morning? It’s not raining, and it’s not warm. Why did it run now? Were there indicators I’d missed?”
I came to the north coast of British Columbia to work in CN Rail’s Skeena avalanche program. I brought seven years of work experience in the Rockies, and ITP training in the Selkirk Mountains and the Coast Ranges. However, I had minimal knowledge of glide slab behaviour.
Glide slab prediction is a challenge, compared to the relative predictability of most maritime snowpack avalanche activity. They are classic poster children for the discussion surrounding why “Hazard Level 2” is perhaps a better descriptor than “Stability Good, with the occasional size 4.” Without start zone instrumentation monitoring glide rates, the CN Skeena program offsets uncertainty to some degree with frequent explosives control, and, where effective, runout zone earthworks.
These are some of the observations on formation and natural initiation I now use to evaluate glide slab stability:
- A low-friction ground surface is important for slab formation, but the degree of support from terrain features immediately below the slab is at least as important for slab failure.
- Rapid, early season snowpack accumulation associated with relatively warm air temperatures increases the likelihood of early- and mid-season glide slab formation.
- Lack of an effective ground freeze prior to snowpack accumulation results in increased mid-winter glide rates.
- Rainfall and meltwater percolation in an isothermal starting zone snowpack may accelerate glide rate by decreasing friction at the slab/ground interface. Free water may also decrease the strength of the supporting snow downslope of the glide slab as well as the slab itself. Rain falling into the glide crack above the slab, likely has a similar net effect. However, rain does not
guarantee slab failure it is only part of the equation.
- Glide slab failure does not require an isothermal snowpack. Failure may occur before the snowpack becomes isothermal or during the overnight cooling phase of the diurnal cycle,
and without free water being present at the snow/ground interface.
Explosives Initiation
The ideal condition for explosives control occurs when the slab itself maintains a degree of strength greater than that of the snowpack below the toe and along the flanks of the slab. In an ideal scenario, a combination of terrain and weather factors unbalances the downslope snowpack stress/strength relationship to a greater degree than within the slab itself. The toe and flanks
are now barely able to support the loading of the gliding slab. Explosives applied at this time cause slab initiation by triggering a failure of the snowpack at the toe of the slab.
Technicians Herb Bleuer and Mike Zylicz began experimenting with charge quantity and placement in the Skeena corridor in the early 1980s. They realized that conventional charge quantity was usually insufficient for glide slab initiation, and that charge placement was extremely critical.
They also realized that placing the explosives charge into the glide crack above the slab was ineffective because that was not where the stress/strength relationship was deteriorating. Effective
glide slab control is about “kicking the knees out” from under the slab, and not adding load to the slab itself. Their testing produced reasonable results using 100-150kg ANFO charges placed at the toe of the slab.
The best charge placement is a very specific point where the gliding slab is having the greatest effect on the non-gliding downslope snowpack. Current Skeena corridor glide slab control strategy includes the use of charges of 150 and 500kg on 200-500cm deep slabs. Large charges are used because they increase the likelihood of triggering, which reduces hazard at the runout zone transportation corridor and minimizes the likelihood of natural events disrupting rail operations.
That said, control is not always successful. A complex, ever-changing interplay of factors affects glide slab stability, and the puzzle is not completely understood.
Some factors I consider in evaluating explosives control effectiveness include:
- Control is more likely to be successful on glide slabs poorly supported by the terrain below the slab. For example, a poorly-supported glide slab can be initiated with explosives so it will then trigger a better supported glide slab lower in the starting zone that does not respond to explosives.
- Rain or melt-water at the ground/snow interface is not essential for initiation to occur, but it does increase the likelihood.
- Initiating sections of glide slabs is useful both by reducing the deposit volume of a single occurrence, but also because it exposes the ground surface to solar radiation, which then potentially aids in increasing glide rate by introducing more heat into the slab’s basal layers.
- The strength of the snowpack below and alongside the slab allows the slab to glide a significant distance downslope without failing. Increasing glide rate may indicate decreasing snowpack strength.
- A 300-600cm slab can easily glide 50-100m without initiating if the downslope snowpack and terrain accommodates the glide’s loading effect. Increasing glide rate and/or deteriorating strength of the snowpack supporting the slab are two critical initiation factors.
- Three reliable nearby indicator paths I use to assess an east aspect path prone to glide slab formation have a northwest aspect, but the starting zones are at the same elevation. This
suggests ambient air temperature affects glide slab behaviour to a lesser, but still relevant, degree.
Prediction and control have improved since the 1980s, but we still include a healthy dose of “art” to the “science” of our craft. Explosives control in January 2012 put a size 4 deposit within 2m of the rail roadbed. Is our understanding of glide slab management improving, or were we just lucky on that mission?
Rod Gee is a CAA and AAA Professional member with 30 years industry experience. His association with Chris Stethem and Associates Ltd. from 1985 to 2011 provided participation in a broad variety of Canadian avalanche programs. Rod is owner of Northwest Avalanche Solutions Ltd., and is based in Terrace, B.C.
Tags:
avalanche journal
glide slabs
rod gee
Permalink
| Comments (0)
|
|
|
Posted By Alex Cooper, Canadian Avalanche Association,
December 4, 2019
|
An Atmospheric River Event in the Colorado Rockies
From Vol. 119, winter 2018-19
By Brian Lazar
THE ASPEN COMMUNITY was rocked April 8, 2018. A long-time and beloved member of the local search and rescue group was killed in an avalanche while skiing recreationally in backcountry terrain adjacent to Aspen Highlands ski area. The entire episode was witnessed by members of the Aspen Highlands Ski Patrol (AHSP) from the ridge and summit patrol shack. It was also captured by a ski area web cam.
The Colorado Avalanche Information Center (CAIC) issued a special product called an Avalanche Warning the morning of the accident. Both the victim and his partner were very experienced backcountry travelers. Both knew the terrain intimately. They witnessed and crossed fresh avalanche debris on adjacent slopes to reach their objective and the site of the accident. The compelling nature of the clues had the snow safety community asking: What happened?
After a summer to reflect on this accident, it’s clear there were several contributing factors and some key take-home lessons that reinforce classic risk management advice in avalanche terrain. Yet it’s hard to escape one critical factor: The two people decided to enter complex avalanche terrain at the tail end of an unusually warm and wet storm.
THE STORM
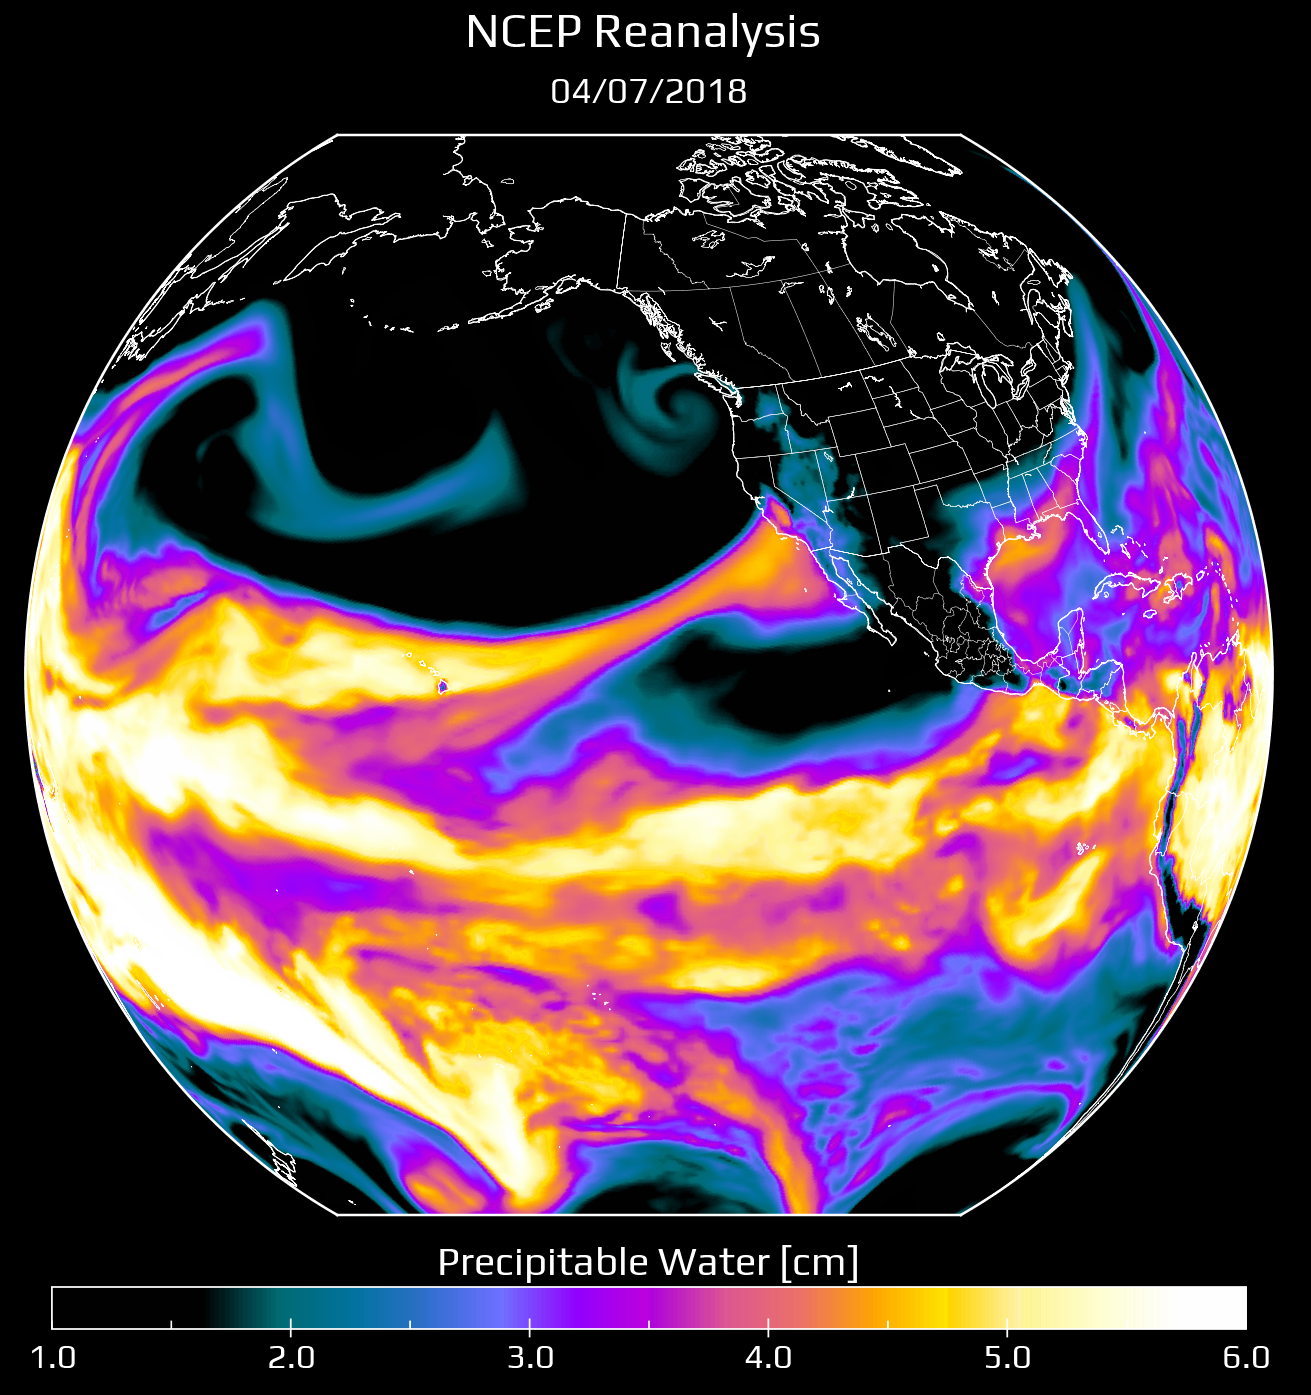
FIG. 1: NATIONAL CENTERS FOR ENVIRONMENT PREDICTION (NCEP) OF PRECIPITABLE WATER ON APRIL 7, THE DAY PRIOR TO ACCIDENT. THIS SHOWS THE ATMOSPHERIC RIVER OF DEEP PACIFIC MOISTURE HEADING TOWARDS COLORADO(IMAGE COURTESY OF NICK BARLOW)
From April 1 to April 5, conditions were typical of early spring weather in Colorado. There were several centimetres of new snow, and above freezing daytime temperatures with below freezing nighttime temperatures. From April 6 to 8, an atmospheric river funneled deep Pacific moisture into the region (Figure 1). The sounding on April 8 from the National Weather Service in Grand Junction (approximately 150 km west of Aspen) showed the atmosphere had deep moisture to around 300 mb, and precipitable water was over 250% of average for the date. Some portions of the state picked up over 150mm HSTW in the 3-day period.
In the Aspen area, the storm began with above freezing temperatures to around 3600 m, and rain as high as 3400 m. Temperatures cooled as the storm progressed, and snow levels dropped. From April 6 to 7, AHSP measured less than 8cm of dense snow (HN24). On the morning of the accident, April 8, AHSP measured HN24 20cm (38mm). Another 3.8cm of snow fell later that same morning. HST totals were 31cm (43mm).
This was an unusual storm for Colorado, even for spring conditions. It was warmer and wetter than what most avalanche professionals in the area typically encounter. Rain at high elevations at the front end of a storm was rare, as was the high-density new snow that followed. The storm loaded a snowpack typical of the region: thin, cold, and with pronounced persistent weak layers.
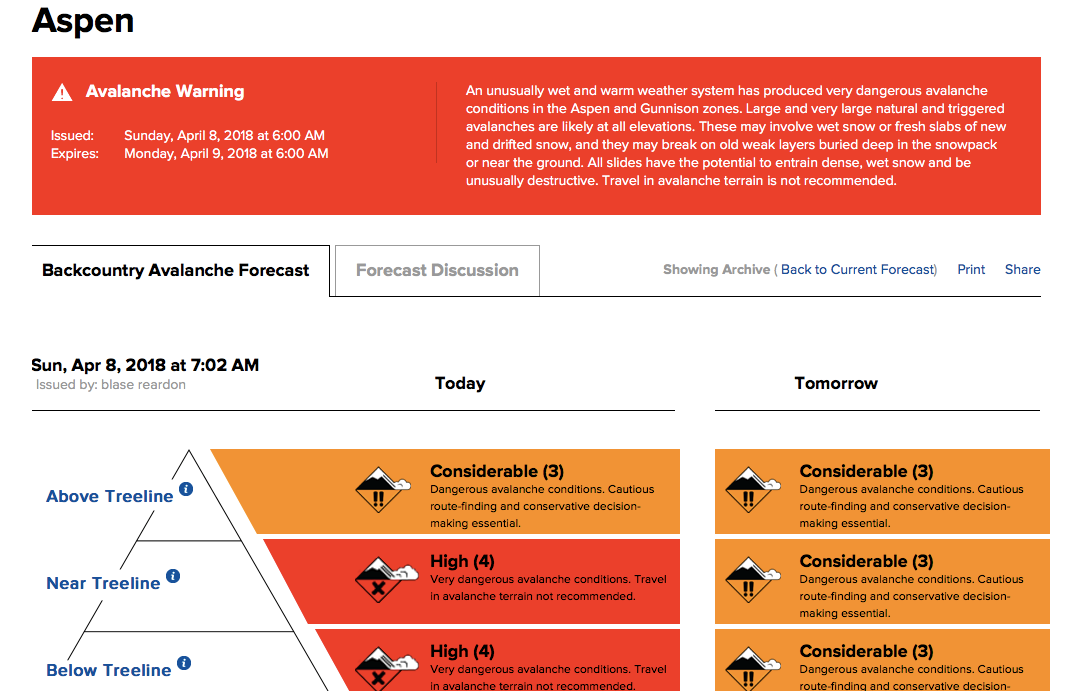
FIG. 2: THE ASHP SNOW SAFETY TEAM WAS ALSO CONCERNED ABOUT THEIR IN-BOUNDS TERRAIN. HIGHLAND BOWL, ON THE OPPOSITE SIDE OF THE RIDGE FROM THE ACCIDENT SITE, REMAINED CLOSED ON THE DAY OF THE ACCIDENT.
THE EVENT
The storm cycle had many avalanche professionals on edge. At the CAIC we engaged in discussions both inside and outside our group about the widespread uncertainty. How would the snowpack respond to the rain, storm snow density changes, and rapid HST settlement?
CAIC forecasters issued a High (Level 4) avalanche danger the morning of the accident (Figure 3) and an accompanying Avalanche Warning advising people to stay out of avalanche terrain.
Post-incident interviews revealed that the two skiers involved discussed the unusual storm. The survivor stated that he did not read the avalanche forecast that morning. We don’t know if the victim knew that there was an avalanche warning in effect or if he was aware of the current backcountry avalanche forecast.
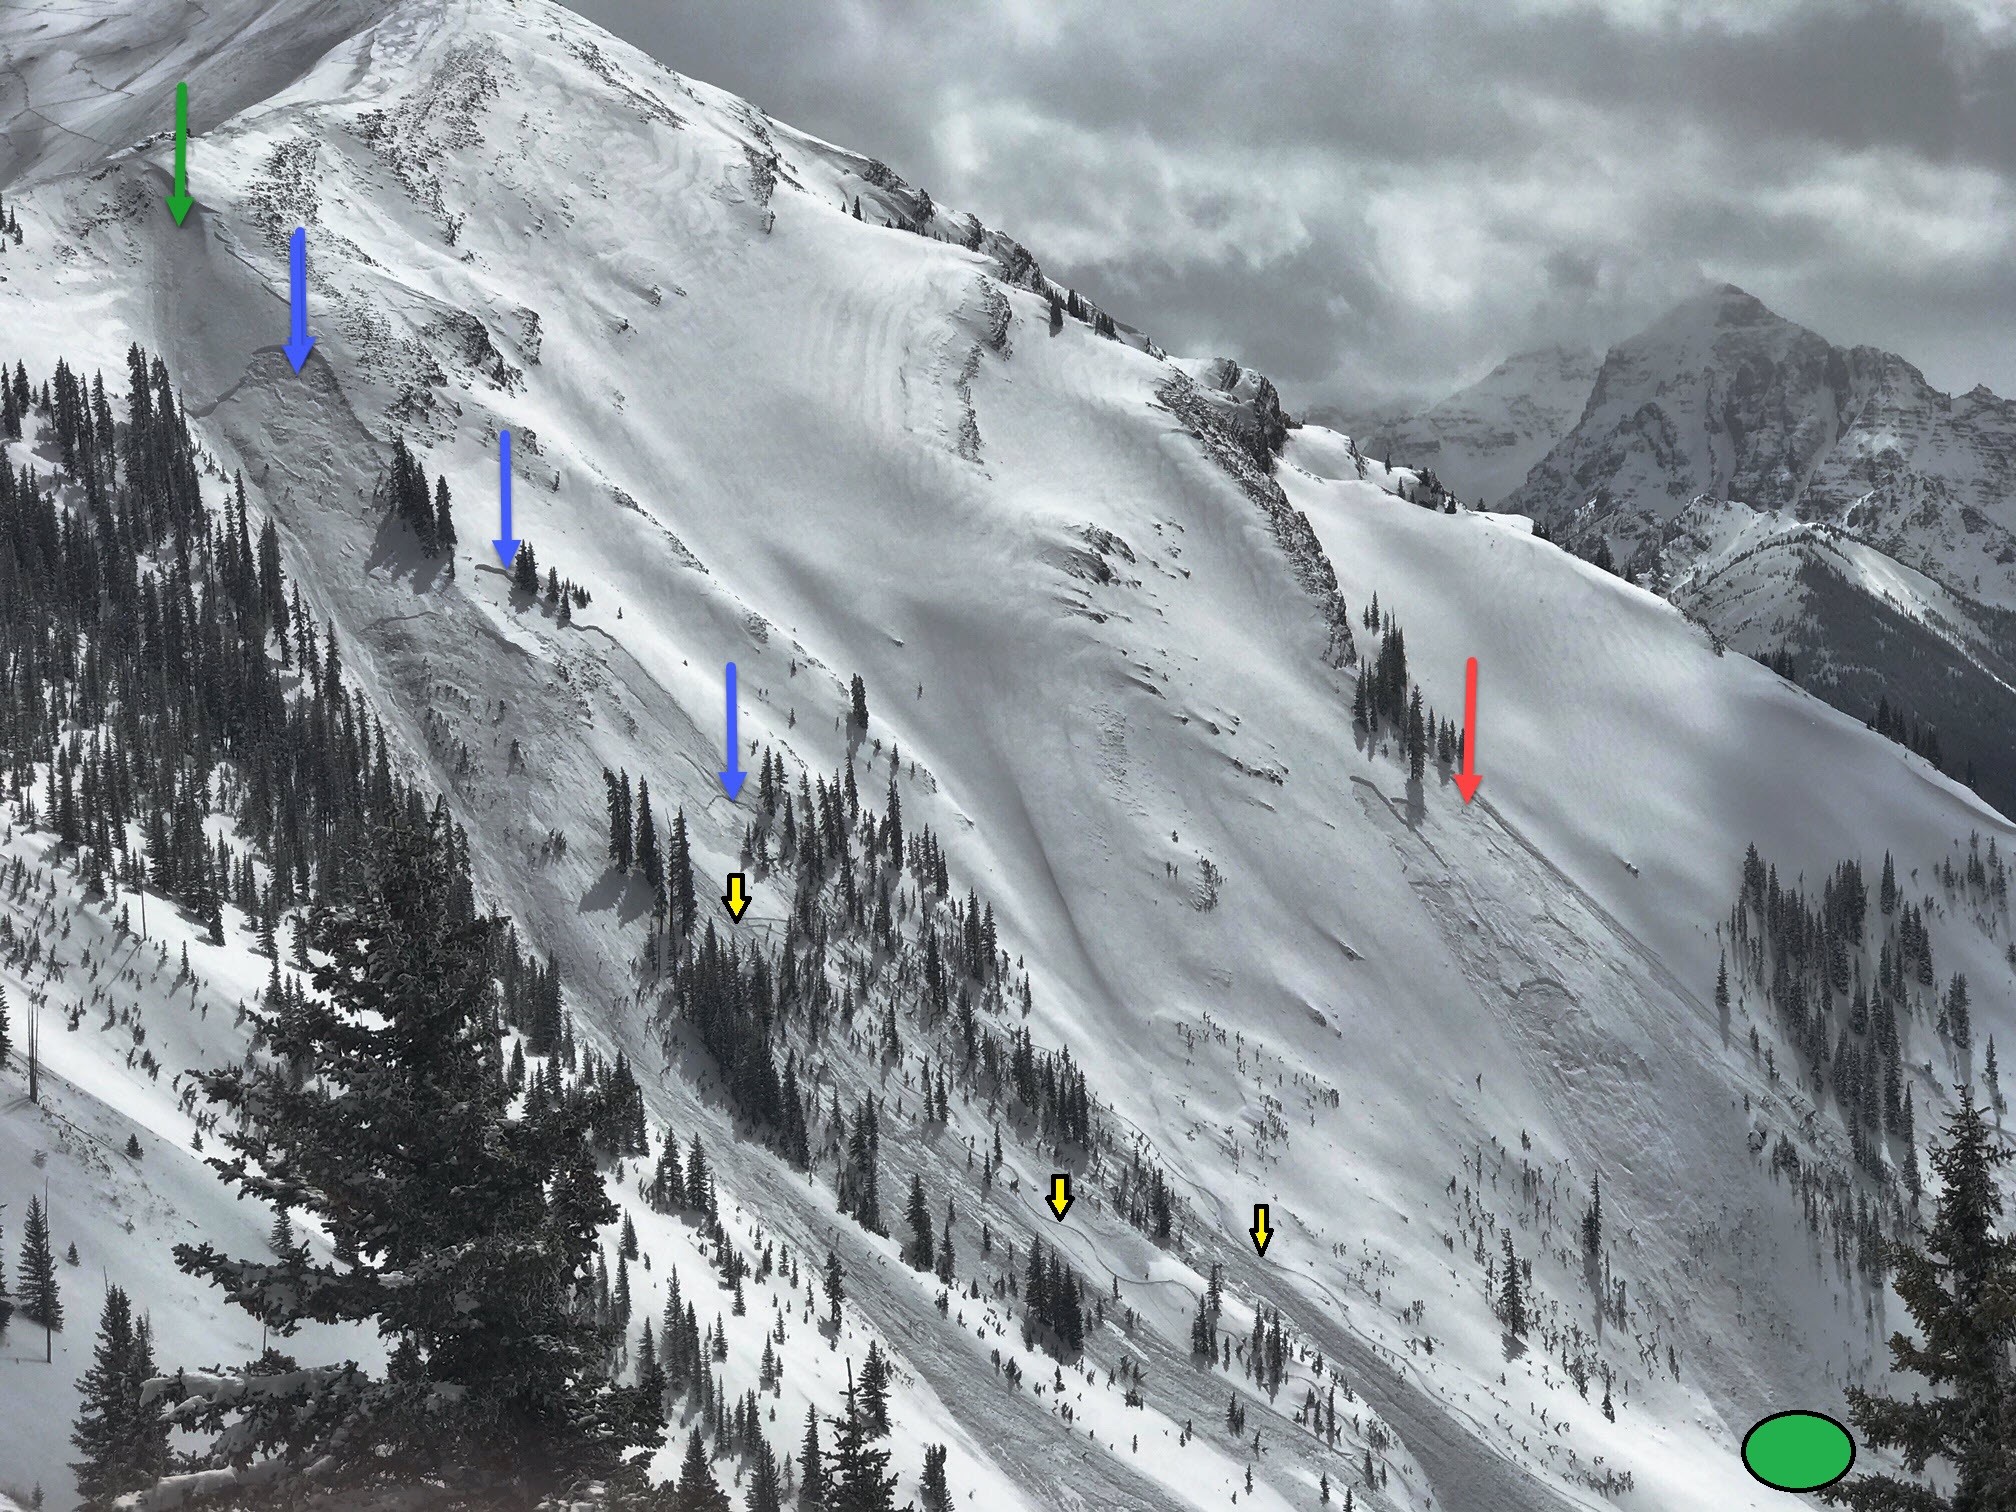
FIG. 3: TRIGGERED SLIDES IN MAROON BOWL, 4-8-18. THE GREEN ARROW MARKS A SMALL AVALANCHE TRIGGERED BY AHSP WITH AN EXPLOSIVE CHARGE ON THE MORNING OF APRIL 8. THE BLUE ARROWS MARK LARGER AVALANCHES TRIGGERED BY THIS SMALL ONE. THESE AVALANCHES WERE VISIBLE BEFORE THE TWO SKIERS DESCENDED THE TREES IN THE LEFT OF THE IMAGE. THE YELLOW ARROWS SHOW THE SKIERS’ TRACKS ACROSS AND ALONG THE AVALANCHE DEBRIS. THE GREEN CIRCLE SHOWS THEIR TRANSITION POINT FROM DOWNHILL TO UPHILL MODE. THE RED ARROW MARKS AVALANCHES THAT WERE TRIGGERED BY SKIERS ASCENDING THE SLOPE THAT AFTERNOON, RESULTING IN A FATALITY. (IMAGE COURTESY OF ART BURROWS)
Clues indicating potentially unstable conditions were evident. The skiers observed fresh avalanches before entering the terrain and crossed avalanche debris to get to their intended route. They determined that the fresh avalanches on adjacent slopes were not pertinent, having seen similar avalanches many times on those same slopes in the past. They completed their initial descent without incident. As they skinned up towards their second descent objective, they made an impromptu decision to continue up a slope steeper than 35 degrees with a terrain trap (trees) below them. The survivor stated afterwards that as they climbed, they noted that conditions on that slope felt different than on the slopes travelled up to that point.
As they climbed up for their next run, they triggered a size 2 avalanche. The crown face appeared to be about 40cm deep and 50m wide. The avalanche initiated on a steep, north-facing, near treeline slope and ran up to 150 vertical metres. It swept both skiers down into sparse trees. The victim stopped at a large tree shortly below a rock outcrop. The survivor continued about 60m further, coming to a rest on the snow surface with both skis still attached to his boots.
Despite witnessing the avalanche, professional ski patrollers and search and rescue members made the excruciating decision not to enter the accident site because of exposure and avalanche hazard. They were able to instruct the survivor via radio to self-evacuate down valley and out of harm’s way. The local Sheriff's Office made the decision not to recover the victim that evening or the next day due to lingering avalanche danger.
THE LESSONS
Some of the lessons are too familiar in avalanche accidents, but they do reinforce the basic messaging we promote as avalanche safety professionals:
- The skiers did not discuss the forecast or the warning, and thus did not discuss the advice to stay out of avalanche terrain. How can we improve our outreach to reach all backcountry users?
- They observed fresh avalanche activity on slopes with the same aspect and elevation but did not find this compelling enough to avoid their objective since they had seen those slopes avalanche many times and intended to avoid those particular features.
- They changed their plan on the fly in the field by climbing higher than intended. They traveled safely until they made this change.
A couple lessons are particular to this storm event, and are cautionary for all of us who work and play in avalanche terrain:
- Terrain familiarity can make it difficult to recognize when conditions are different from those previously experienced. This group had used this route before in a variety of conditions. Weather and climate are changing, and we need to be humble in accepting that our methods and evaluations need to be reconsidered. The tried and true approach to risk management can fail.
- Although we could not readily access the crown in our investigation due to lingering hazard, rain at the front end of the storm was likely a contributing factor. We all need to carefully consider rain on snow effects, even those of us who work in historically cold interior climates.
The intent in writing up this case study is not to cast judgment on those involved. Rather, the hope is that an honest reflection will challenge us all to consider what we can do better and to be on guard for storm systems that fall outside past experiences. The times, they are a changin’.
Tags:
aspen
atmospheric river
avalanche incident
avalanche journal
case study
colorado avalanche information centre
fatality
Permalink
| Comments (0)
|
|
|
Posted By Alex Cooper, Canadian Avalanche Association,
November 20, 2019
|
From vol. 111, winter 2015
By Colin Zacharias

Conducting an extended column test. Photo by Colin Zacharias
THE WEIGHT OF EVIDENCE
Every winter day we make snowpack observations and extrapolate from observation sites to nearby terrain. Most days, for most avalanche problems, this extrapolation process works and we make key decisions from comparatively few quality bits of information. But it is easy to lose confidence in our abilities when conditions become unfamiliar or our information becomes scarce.
Outside of current avalanching and other alarm signs, and especially during periods of high snowpack variability, experienced observers tend to steer away from drawing quick conclusions from a few snowpack observations. They recognize that one test is just one observation, and to counter possible extrapolation errors they ensure that over the critical timeframe key information is supported and verified.
On the other hand, inexperienced observers may apply too much importance to a persuasive snowpack test result or a single avalanche occurrence and be subject to a confirmation bias. Experienced forecasters, even with a decent amount of information, recognize that at times their best is still in the end just that.
Karl Klassen, Avalanche Canada Public Avalanche Warning Service Manager and mountains guide, recently reminded me with a nice touch of irony that while our data -> information -> knowledge -> wisdom hierarchy (Zeleny 1987) fits into a neat little package, it can also backfire. Depending on the quality and quantity of the data set, its relevancy, and our ability to interpret the info, data isn’t information and information isn’t knowledge, and if one thing is certain, wisdom is a different kettle of fish.
There are times when logistics make it difficult to add weight to the evidence. Poor weather or difficult travel conditions, for example, may prevent access to terrain or study sites. Yet even then assumptions are made and conclusions derived. As Dr. Bruce Jamieson notes in his mountain snowpack presentation for the ITP Level 2 Module 1, “inaccurate assumptions can have serious consequences” when it comes to spatial variability in the mountain snowpack.
Decisions made from a deficit or even partial deficiency of information required to understand the avalanche problem are considered uncertain in light of an applied risk management strategy (as defined by ISO 31000). In the avalanche world we are okay with uncertainty—so long as we know what we don’t know. We understand that as the measure of uncertainty increases so does that long arm of caution when planning to reduce the risk.
In today’s avalanche world in Southern BC and Alberta, professionals rely on a daily information exchange to help manage the complexity of snowpack/terrain variability, to provide a “heads up” early warning system or a nearest neighbor confirmation— “yes, they’re seeing what we’re seeing.” Each day we scan through thousands of bits of data and information on the InfoEx, then go into the field and gather more, aggregate the data into information packets, and analyze and communicate patterns that we refer to as hazard factors.
This article, along with the “How Useful Is the Evidence?” table below, was developed in the fall of 2011 as part of an Avalanche Operations Level 2 Module 3 training course handout to help learners apply the notion of strength and weight to field observations, to use a checklist style verification process, and to encourage quality craftsmanship and a thorough approach when analyzing and discussing snowpack factors. It may help the learner to recognize whether or not their evidence drawn from snowpack tests is helpful to their decisions.
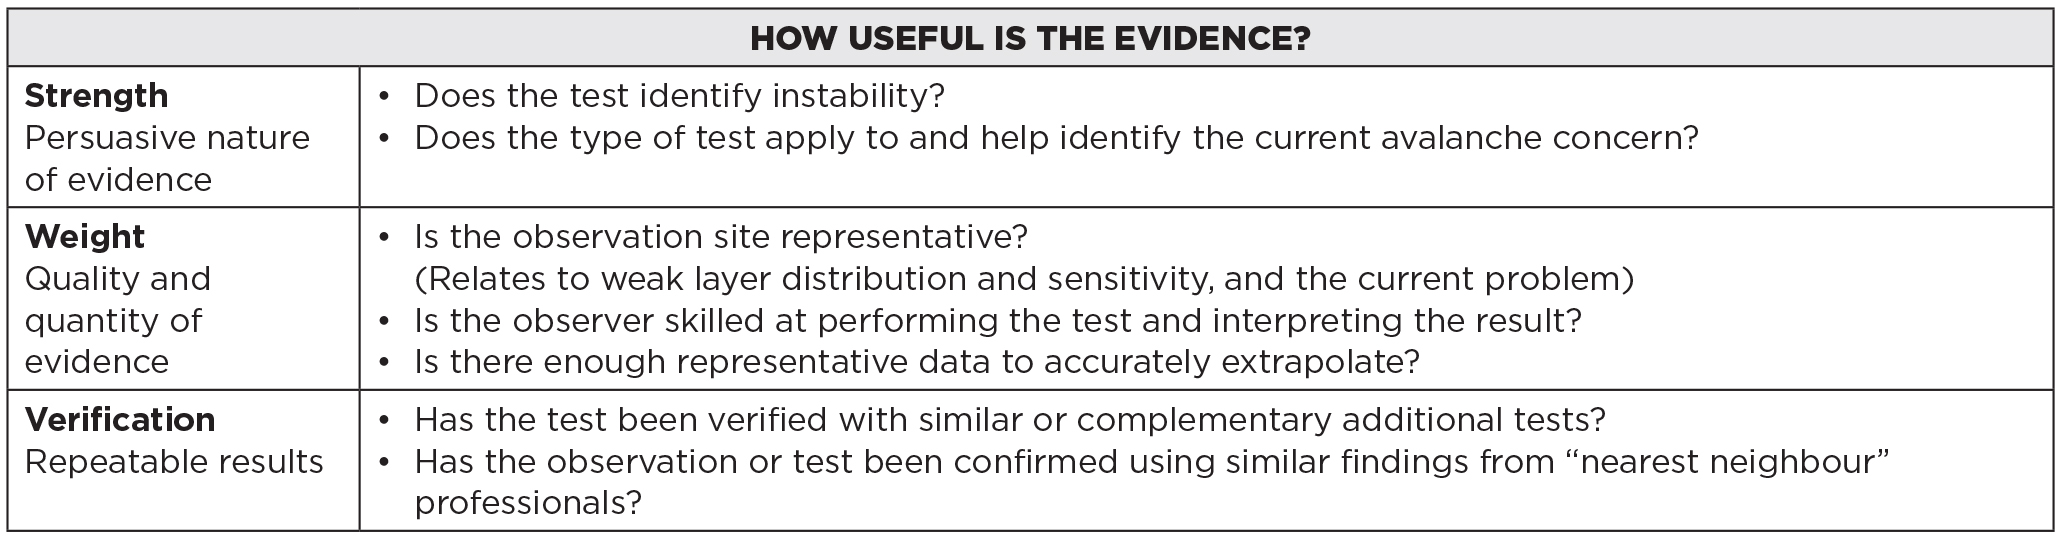
Fig. 1: From CAA Level 2 Module 3 handout
CRAFTSMANSHIP AND CONSISTENCY
“Jeez…. the weather and snowpack vary enough; can’t we all just do the same damn observation the same damn way?”
Regional and operational consistency with technique, application and interpretation ensures the quality of data gathered, recorded and communicated. On professional level avalanche training courses, instructors inform that practice, technique, and a meticulous day-to-day consistency with observations, recording and communication should never be undervalued, nor should the scope of the task be underestimated:
- Ensure that there is an objective for each snowpack test. The early morning safety meeting agenda usually includes assessing the day’s avalanche problem and identifying gaps in knowledge. Know what you’re looking for prior to looking.
- Select relevant sites for field test sites using experience and the seasonal observation of how the snow is layered over the terrain. Once sites have proven their worth, they are repeatedly used season to season.
- Conduct tests skillfully using standardized, practiced techniques. Observers use established guidelines when conducting, recording, and communicating weather, snowpack and avalanche observations; these come from Observation Guidelines and Recording Standards for Weather, Snowpack and Avalanches (OGRS) and Snow, Weather, and Avalanches: Observation Guidelines for Avalanche Programs in the United States (SWAG).
- Ensure consistency within an operation by having employees conduct observations side by side. Discuss technique and compare interpretation during preseason staff training.
THE RIGHT TOOL FOR THE RIGHT JOB
The CAA’s OGRS and the AAA’s SWAG provide guidelines for how to conduct and record weather, snowpack, and avalanche observations. Other than a few comments about the observed limitation of certain tests, these guidelines deliberately offer little information on how to apply or interpret the observations as they relate to an avalanche problem or forecast. This knowledge and proficiency is gained through other means, including research articles, professional avalanche training, and on the job training and mentorship.
Of course there isn’t any single test that will reveal exactly what you need to know about snow. Yet every decade or so it seems that guides and forecasters have a new favourite “go to” decision making aid they default to when investigating the current avalanche problem. First it was the Rutschblock test (RB), then the compression test (CT)—or the other way around depending on your region—and now it’s the extended column test (ECT). In a helpful 2010 article “Which Obs for Which Avalanche Type?” Bruce Jamieson and others conducted a field study that did an excellent job of directing attention to those observations that best identify each avalanche concern. The combination of determining the avalanche problem prior to departure (Atkins 2004) and having a good idea about which field observations and tests will best identify the problem is a good start when choosing the right tool for the right problem.
The AIARE Avalanches and Observations Reference included below (published in the AIARE Field Book and instructor materials) was inspired by the aforementioned article and is a useful field reference to help learners target those concerns described in the daily avalanche advisory.
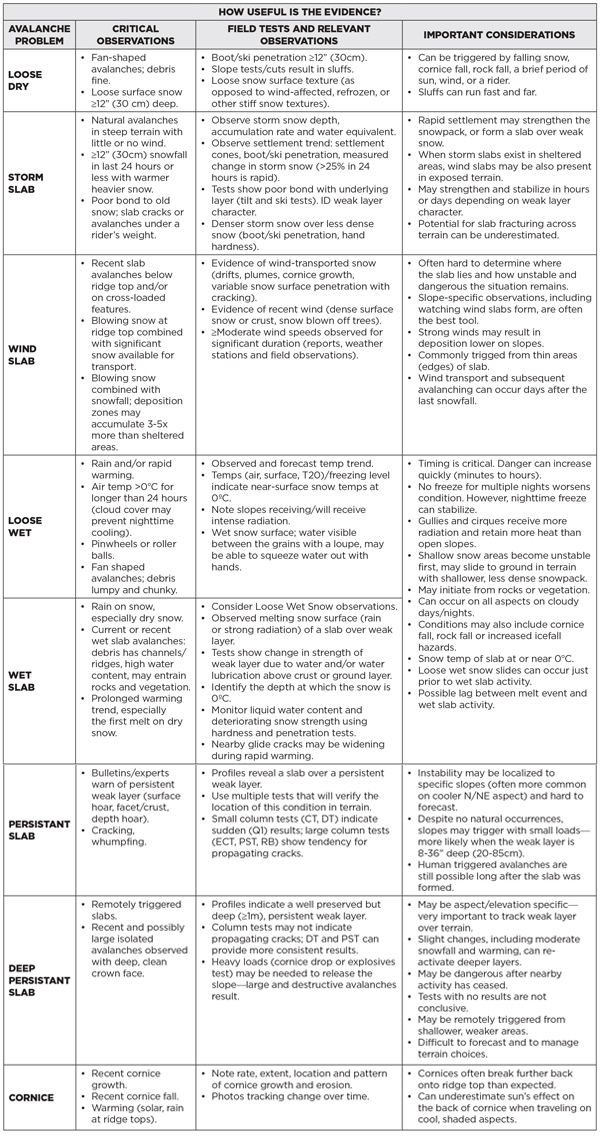
Fig. 2: From AIARE instructor materials and field book, 2012
MANAGING FALSE STABLE AND FALSE UNSTABLE RESULTS
Doug Chabot, forecaster at the Gallatin National Forest Avalanche Center, brings up a good point in a recent blog post: “Snowpit tests are used to show instability, not stability. Never stability. Snow pits (and snowpack tests) do not give the green light to ski; they just give us the red light to not ski. An unstable test result is always critical information. A stable test result does not mean the snow is stable a hundred feet away.”
Chabot’s advice points to the quandary many backcountry recreationists face when analyzing snowpack factors: a test result illustrating unstable snow urges cautious risk reduction, but what does a “no result” mean? Yet estimating where the snow is strong and where the snow is weak is an important skill—particularly for guides committing clients to terrain. Determining stability or the “likelihood that avalanches will not occur” involves a detailed process of gathering evidence, drawing a big picture perspective and not leaping to conclusions from a single observation or test result.
- Knowing the sites that information is coming from, having a systematic or “toolbox approach” to clue gathering (see Fig. 3), and observing the terrain and trends over time are all crucial links in the chain of gathering information and applying it to a hazard analysis. And knowing to what degree those links are missing and then defining the information deficit (whether the uncertainty is weak layer location and distribution, character and sensitivity, or slab characteristic and estimation of destructive potential) is all part of guide and forecaster daily discussion. In addition to the strength, weight and verification checklist provided in Fig. 1, the following points may help when interpreting the day’s investigations.
- A seasonal perspective of where the terrain has historically formed stronger and weaker snow is important. Basal facet development tends to repeat itself in seasonal trends. While near-surface persistent weak layers tend to have a broader distribution, sun or wind effect can result in feature scale variability in weak layer character. For example, DF (decomposed and fragmented snow grain) layers can be unstable locally but may not be problematic on a drainage scale. Expect a higher incident of false stable test results when observing locally unstable layers like DFs, graupel or sun crust/DF interfaces.
- One of the best tools for determining the nature of snowpack variability is to simply observe and memorize how the current snow surface or near surface condition changes over the terrain. Knowing the extent of surface hoar, facet, crust, or graupel formation and the distribution of storm snow and wind redistribution of snow helps to form a baseline when later estimating snowpack strength. Imagine yourself a heli ski guide with the opportunity to travel over 10s or 100s of kilometres of terrain on any given day. Using your eyes, your skis, and a few quick penetration and hand tests provides insight into what to expect when the snow surface becomes a buried weak layer. “Quick tests,” while not subject to the same formal research as standard tests, still provide helpful information to an approximate depth of 45cm (Schweizer and Jamieson 2010).
- A checklist sum of snowpack structural properties (a.k.a. “yellow flags” or the Snowprofile Checklist (Jamieson and Schweizer 2005)) provide valuable clues about which layer interface is most likely to result in a localized failure/fracture. However, as the checklist sum has a tendency to overestimate instability (false unstable=false alarm), further tests are conducted to determine propensity for propagation (Winkler and Schweitzer 2008). The combination of CTs (with fracture character) and the profile checklist sums provide an excellent tool to determine which layer is worth testing prior to a propagation saw test (PST) or ECT propagation propensity test.
- The large column snowpack tests that employ taps or jumps to apply a load to the slab (e.g., the ECT and RB) may still indicate a “no result” when a significant weak layer is buried approximately 1m or deeper—and/or when stiffer snowpack layer characteristics (e.g., a crust) reduce the likelihood that surface taps are affecting the deeper weak layer. The cautionary note is that skier triggering of a layer of this depth may still occur from shallower or weaker area (see case history below). In this scenario, one would not use the ECT or RB as the sole observation tool. It may be more prudent to identify the deeper weak layer with a CT or deep tap test (DT) and if a sudden fracture is observed choose to conduct a PST (or choose a shallower location for an ECT) to observe propensity for crack propagation in the layer. The combination of the small column test (which may err on false unstable but identifies fracture character) combined with a large column test (testing for propagation propensity) both reduces the likelihood of a missed observation and provides more information with a verified result. This “toolbox approach” may help interpret a potential “no result” or a false stable result.
The 2010 Schweizer and Jamieson article “Snowpack Tests for Assessing Snow-Slope Instability” provides an updated, excellent perspective directed at a general audience on snowpack test use and limitations. The following summary points have been paraphrased from the article:
- A good test method should predict stable and unstable scenarios equally well.
- Column tests are particularly helpful for assessing persistent slab conditions.
- Small column tests (CT and DT test) are useful for identifying weak layers and likelihood of initiation but have a tendency to overestimate instability (false unstable) conditions. Observing fracture character improves, to a degree, the interpretation of the test results. These tests are a better indicator of layer character than instability.
- Large column tests are better at predicting propensity for fracture propagation than small column tests, particularly when used in combination with other large column tests. Comparative studies suggest that the RB, ECT, and PST have comparable accuracy.
- With large column tests, repeated test results in the same location are useful but the tests repeated on similar, nearby slopes add value.
- Each test has a margin of error. Even with very experienced observers an error rate of 5-10% is to be expected. Site selection and interpretation require experience.
A TOOLBOX APPROACH TO INVESTIGATING LAYERS OF CONCERN
The Toolbox Approach in Fig. 3 may help students avoid the relatively high number of false predictions that occur due to a combination of several factors, such as extrapolation from single tests and high snowpack variability. The diagram supports a dialogue encouraging students to take a step-by-step approach and observe clues from a combination of tests and observation methods. For example, the combination of both the “yellow flags” checklist sums and fracture character in compression tests provide clues, not confirmation about whether or not a “propagation likely” scenario exists, which is then verified with a large column test that is suitable for testing within limitations posed by the particular snowpack structural properties. Understanding test limitations, matching the test to observed structural properties and verifying observations with complementary tests may improve the ability to interpret the test results and reduce false stable or false unstable predictions. I created this diagram and instructional method five years ago and have included it on the L2M3 and American professional level courses.

FIG. 3 The toolbox approach, ver. 6, Zacharias, 2015
A CAUTIONARY TALE
Backcountry winter travelers are always encouraged to make weather and snowpack observations in the field, and when possible identify on a drainage and slope scale what the public avalanche advisory describes for the region or range. For the most part, this is an effective risk management strategy. However, there have been a number of close calls, incidents and avalanche accidents with backcountry users increase their risk by not managing exposure when gathering information or misinterpreting the observations they collect. In December 2007, a fatal avalanche accident occurred on Tent Ridge in Kananaskis Country when two backcountry skiers were killed conducting a snow profile in the start zone of an avalanche path. Older examples of riders conducting tests on or very near the slope and being subsequently killed include Wawa Bowl, AB, and Mt. Neptune, BC in 1984, Thunder River, BC in 1987, and White Creek, BC in 1993. More recent incidents include Ningunsaw Pass, BC in 1999 and in Twin Lakes, CO in 2014, where a group of seven dug a profile and conducted eight CTs on a slope before choosing to ski it (see CAIC Incident Report for more information).
There are also several examples of “close calls” where test results gathered and extrapolated to chosen terrain illustrated one problem but not the primary concern. A recent example occurred in December 2013 in Hope Creek, BC involving two backcountry skiers. This is an unfortunate example where a combination of well-intentioned observations formulated a confirmation bias and decision making trap. The rider’s observations prior to descending the slope included three existing ski tracks on the slope, 15cm recent snow, light winds, -3°C and no recent avalanches. The group conducted several tests with the following results: CTM16 (SC), ECTP 23, and “numerous ski cuts in the start zone,” all revealing a significant surface hoar layer (size 7-10mm) 40cm deep but nothing deeper. A DT also revealed no results on deeper layers. The group decided that the surface hoar layer was manageable and to ski the slope one at a time. Rider 1 skied the slope with no problems and stopped 400m below, adjacent to the path trim line. Unfortunately, Rider 2 triggered the slope after landing an air low down in the start zone. The resulting D3 avalanche fractured 100m wide on basal facets 80-120cm deep and well below the surface hoar layer. The fast moving avalanche debris caught Rider 1 on the path’s edge before he could scramble to safety. Both involved were carried approximately 700m downslope. Both were buried and badly injured but were able to self extricate, call for help, and were successfully rescued
(Editor’s Note: read a first-hand account of this avalanche by Billy Neilson in The Avalanche Journal Volume 106).
Those involved generously provided the CAA occurrence report with snowpack observations and insight into what gave them confidence to venture onto this particular slope. This event is a helpful wake-up call as we can all place ourselves in their decision making shoes. In hindsight, it is revealing to examine the Kicking Horse Mountain Resort local forecaster’s public video statement issued on Vimeo on December 13, 2013 for the nearby backcountry terrain. The forecaster warned there is a “basal weakness at the bottom of the snowpack that is still reactive,” and “skier triggered size 3 avalanches have occurred,” and “avalanches had triggered larger slopes sympathetically,” and that “now is the time to be very mindful of slope history.” He went on to emphasize “without that degree of confidence that an avalanche has happened [on your slope of interest], you are really rolling the dice hopping onto big terrain.” This incident—though occurring over one week after the video statement—illustrates that when it comes to managing deeper persistent slabs, the careful observations and good well-learned techniques of the backcountry travelers were not sufficient to protect them from the lingering hazard. It also reveals the big-picture perspective of the forecaster, who clearly warned of the more serious basal concern.
Experience with this type of problem, experience monitoring unstable snow in a shallower snow climate, experience matching specific tests to specific problems, and experience managing false stable results and prioritizing the key concerns are all factors that may have given the experienced forecaster a different perspective than the backcountry riders. In this case, the knowledge of how the snowpack lay over the terrain held more weight than even a series of test results, all of which drew attention to a secondary problem that, while significant, was less so than what lurked below.
The bottom line is snowpack tests used to predict instability, while valuable when employed appropriately, are not foolproof. As Schweizer and Jamieson state obviously and importantly in the aforementioned 2010 article, “decisions about traveling in terrain should not be based solely on stability (snowpack) test results.”
REFERENCES
American Avalanche Association and USDA Forest Service National Avalanche Center. 2010. Snow, Weather and Avalanches: Observation Guidelines for Avalanche Programs in the United States. 2010. Pasoga Springs, CO: AAA. http://www.avalanche.org/research/guidelines/pdf/Introduction.pdf
Atkins, Roger. 2004. “An Avalanche Characterization Checklist for Backcountry Travel Decisions." Proceedings of the 2004 International Snow Science Workshop. Jackson Hole, WY. http://arc.lib.montana.edu/snow-science/objects/issw-2004-462-468.pdf.
Avalanche Canada Incident Report Database. Golden, Hope Creek Draining, Privateer Mountain. December 29, 2013. http://old.avalanche.ca/cac/library/incident-reportdatabase/view.
Campbell, Cam. 2008. “Testing for Initiation and Propagation Propensity.” Canadian Avalanche Association Level 2 Module 3 Lecture.
Canadian Avalanche Association. 2014. Observation Guidelines and Recording Standards for Weather, Snowpack and Avalanches. Revelstoke: CAA. www.avalancheassociation.ca/resource/resmgr/Standards_Docs/OGRS2014web.pdf
Chabot, Doug. “Another viewpoint on a Backcountry Magazine article.” Gallatin National Forest Avalanche Center Blog, November 6, 2015. http://www.mtavalanche.com/blog/another-viewpoint-backcountry-magazine-article
Colorado Avalanche Information Center. Colorado, Star Mountain. February 15, 2015. https://avalanche.state.co.us/caic/acc/acc_report.php?acc_id=526&accfm=inv
Gauthier, Dave, Cameron Ross, and Bruce Jamieson. 2008. “How To: The Propagation Saw Test.” University of Calgary Applied Snow and Avalanche Research. October 2008. http://www.ucalgary.ca/asarc/files/asarc/PstHowTo_Ross_Oct08.pdf.
Jamieson, Bruce. 2009. “Mountain Snowpack and Spatial Variability.” Canadian Avalanche Association Level 2 Module 1 Lecture.
Jamieson, Bruce. 2003. “Risk Management for the Spatial Variable Snowpack.” Avalanche News 66 (Fall 2003): 30-31.
Jamieson, Bruce and Jürg Schweizer. 2005. “Using a Checklist to Assess Manual Snow Profiles.”
Avalanche News 72 (Spring 2005): 57-61.
Jamieson, Bruce and Torsten Geldsetzer. 1996. Avalanche Accidents in Canada Volume 4: 1984-1996. Revelstoke: Canadian Avalanche Association.
Jamieson, Bruce, Jürg Schweizer, Grant Statham and Pascal Haegeli. 2010. “Which Obs for Which Avalanche Type?” Proceedings of the 2010 International Snow Science Workshop. Squaw Valley, CA. http://arc.lib.montana.edu/snowscience/objects/ISSW_O-029.pdf
Klassen, Karl. 2002. American Institute for Avalanche Research and Education Level 2 Student Manual. 2002 Version.
Ross, Cameron, and Bruce Jamieson. 2008. “Comparing Fracture Propagation Tests and Relating Test Results to Snowpack Characteristics.” Proceedings of the 2008 International Snow Science Workshop. Whistler, BC. http://arc.lib.montana.edu/snow-science/objects/P__8177.pdf.
Schweizer, Jürg and J. Bruce Jamieson. 2010. “Snowpack Tests for Assessing Snow-Slope
Instability.” Annals of Glaciology 51(54): 187-194.
Simenhois, Ron and Karl Birkeland. 2007. “An update on the Extended Column Test: New Recording Standards and Additional Data Analyses.” The Avalanche Review 26(2).
Zeleny, Milan. 1987. “‘Management Support Systems: Towards Integrated Knowledge Management.” Human Systems Management 7: 59–70.
“Skiers Died Testing for Avalanche.” The Calgary Herald, December 11, 2007. Accessed December 10, 2015. http://www.canada.com/story.html?id=75d72a3c-c743-4c65-a0c2-a18728813217.
Tags:
avalanche journal
colin zacharias
snowpack tests
Permalink
| Comments (0)
|
|
|
Posted By Alex Cooper, Canadian Avalanche Association,
November 13, 2019
|
From volume 108, winter 2014-15
By Steve Brushey
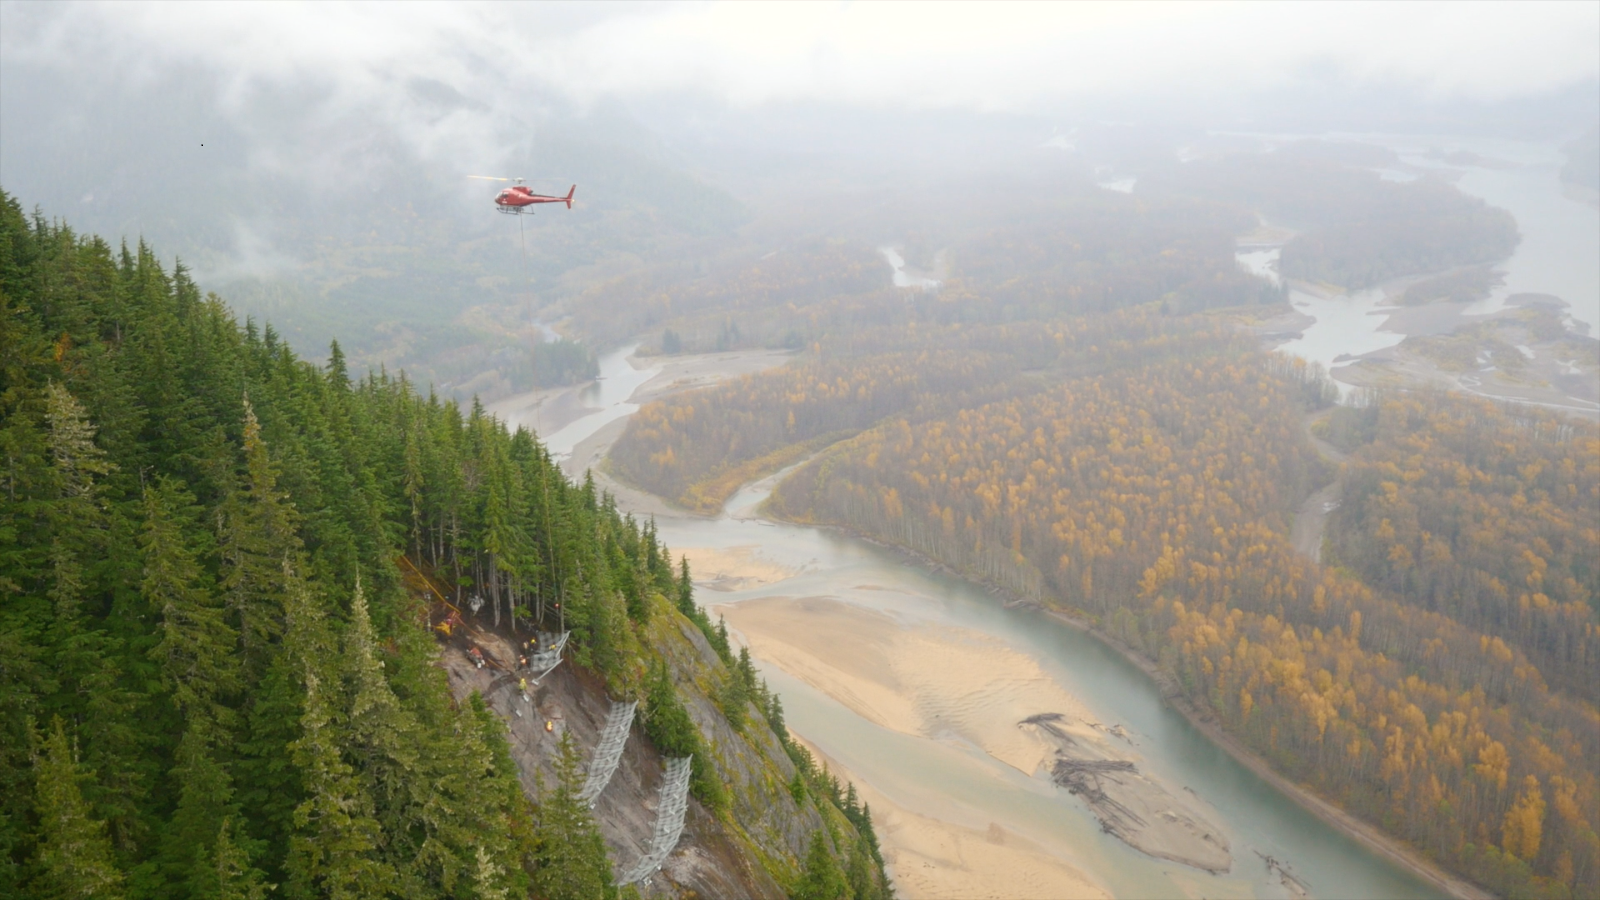
Photo: Because the site was only accessible by helicopter, Quantum Helicopters in Terrace was contracted, providing daily access to the site and slinging of all materials, requiring a total of 75 hours of flying. By Steve Brushey.
APPROXIMATELY 80% OF HIGHWAY avalanche road closures along Highway 16W occur in the 35 Mile avalanche area, located 56.4km west of Terrace. Compounding the problem is restrictive narrow lane width, due to a CN rail track on the south side of the highway and the 35 Mile rock bluff on the north side. Poor sight lines, and lack of a ditch and snow storage add to the 35 Mile problem. This area is also prone to ice fall, resulting in motor vehicle accidents and numerous near misses. Currently the avalanche hazard at 35 Mile is managed through preventative closures and avalanche control, which fall under the Ministry of Transportation and Infrastructure Avalanche Safety Plan. The ice fall hazard remains the responsibility of the maintenance contractor and is mitigated using a high powered rifle with limited success.
During the winter of 2012-13, an increase in ice fall garnered the attention of Ministry representatives. A consultant was hired to find a solution to both the ice fall and avalanche hazard. Thurber Engineering and Dynamic Avalanche Consulting were retained to provide ice fall solutions, rock structure mapping and avalanche fencing design.
The Thurber/Dynamic report’s scope only considered avalanche fencing structures. The study did not include avalanche control products, as the Ministry of Transportation Avalanche and Weather Program preferred a longer term, more permanent solution that would eliminate the need to do control work at the East Bluffs, significantly reduce or eliminate avalanche hazard forecasting, and provide a cost effective solution. Of interest, McElhanney Engineering was retained by a regional project management team, which looked at several high level solutions which included rock cuts, tunnel, causeway and snow shed options. Costs ranged from $37 million to $140 million. Other than the snow shed option, avalanche snow fencing would be required for all of the other options. Avalanche snow fencing made the most sense economically in both the short and long term, given the scope of the initial project.
The MoT Northwest Avalanche Program was concerned about the potential for the snow fences to increase the amount of melt water through melt-freeze cycles, leading to a possible increase in ice fall. In order to further study the potential problem, the Mid-Chutes section of 35 Mile was selected for a trial fencing project. If meltwater or ice fall increased, the likelihood of falling ice impacting the highway would be negligible due to terrain configuration at the Mid-Chutes. In addition, the avalanche hazard at the Mid-Chutes would be mitigated.
During the early spring of 2013, the Northwest Avalanche Program gathered the necessary permits required to proceed with the project. These included archeological and environmental assessments, and a permit to construct a helicopter pad in advance of any required work. During this time, Thurber/Dynamic made site visits to the area to gather information and data required to complete their initial report. This report was finalized in August 2013.
Due to various delays, in the fall of 2013 the project was postponed until 2014. In December 2013, 81.7m of 3.0Dk GeoBrugg Spider Avalanche Fencing arrived in Terrace and was stored for the winter.
In the spring of 2014, the Northwest Avalanche Program began administrating a contract for the installation of the fencing at the Mid-Chutes. Retaining an Engineer of Record for the project did prove to be a challenge, however once finalized, the planning and design of the installation began. This took longer than anticipated. Due to the overall cost estimate, the project now qualified as a Major Works Project and was advertised on BC Bid for qualified installers. The contract closed in early September and the contract was awarded to Pacific Blasting and Demolition of Burnaby, BC. Installation began on September 26 and was completed November 4, 2014.
The installation consisted of several phases involving site preparation and danger tree removal, fence and anchor layout, anchor drilling and grouting, anchor testing, and fence installation. During this time, technical support was provided by Geobrugg, Dynamic Avalanche Consulting and Thurber Engineering. Because the site was only accessible by helicopter, Quantum Helicopters in Terrace was contracted, providing daily access to the site and slinging of all materials, requiring a total of 75 hours of flying. A gravel pit close to the work site was used for the daily mobilization of crew and materials.
Traffic control was required throughout the duration of the project, requiring delays of up to 20 minutes to ensure public safety while Pacific Blasting and Demolition crews performed their work 350m above the highway. During the initial phase of danger tree removal, several track occupancy permits were required from CN Rail in order to safeguard the rail right of way.
Despite a very wet fall, the project was delayed for only three days when crews could not work. This proved testament to the hardy nature of the installation crew and the expert flying of Quantum Helicopter pilots.
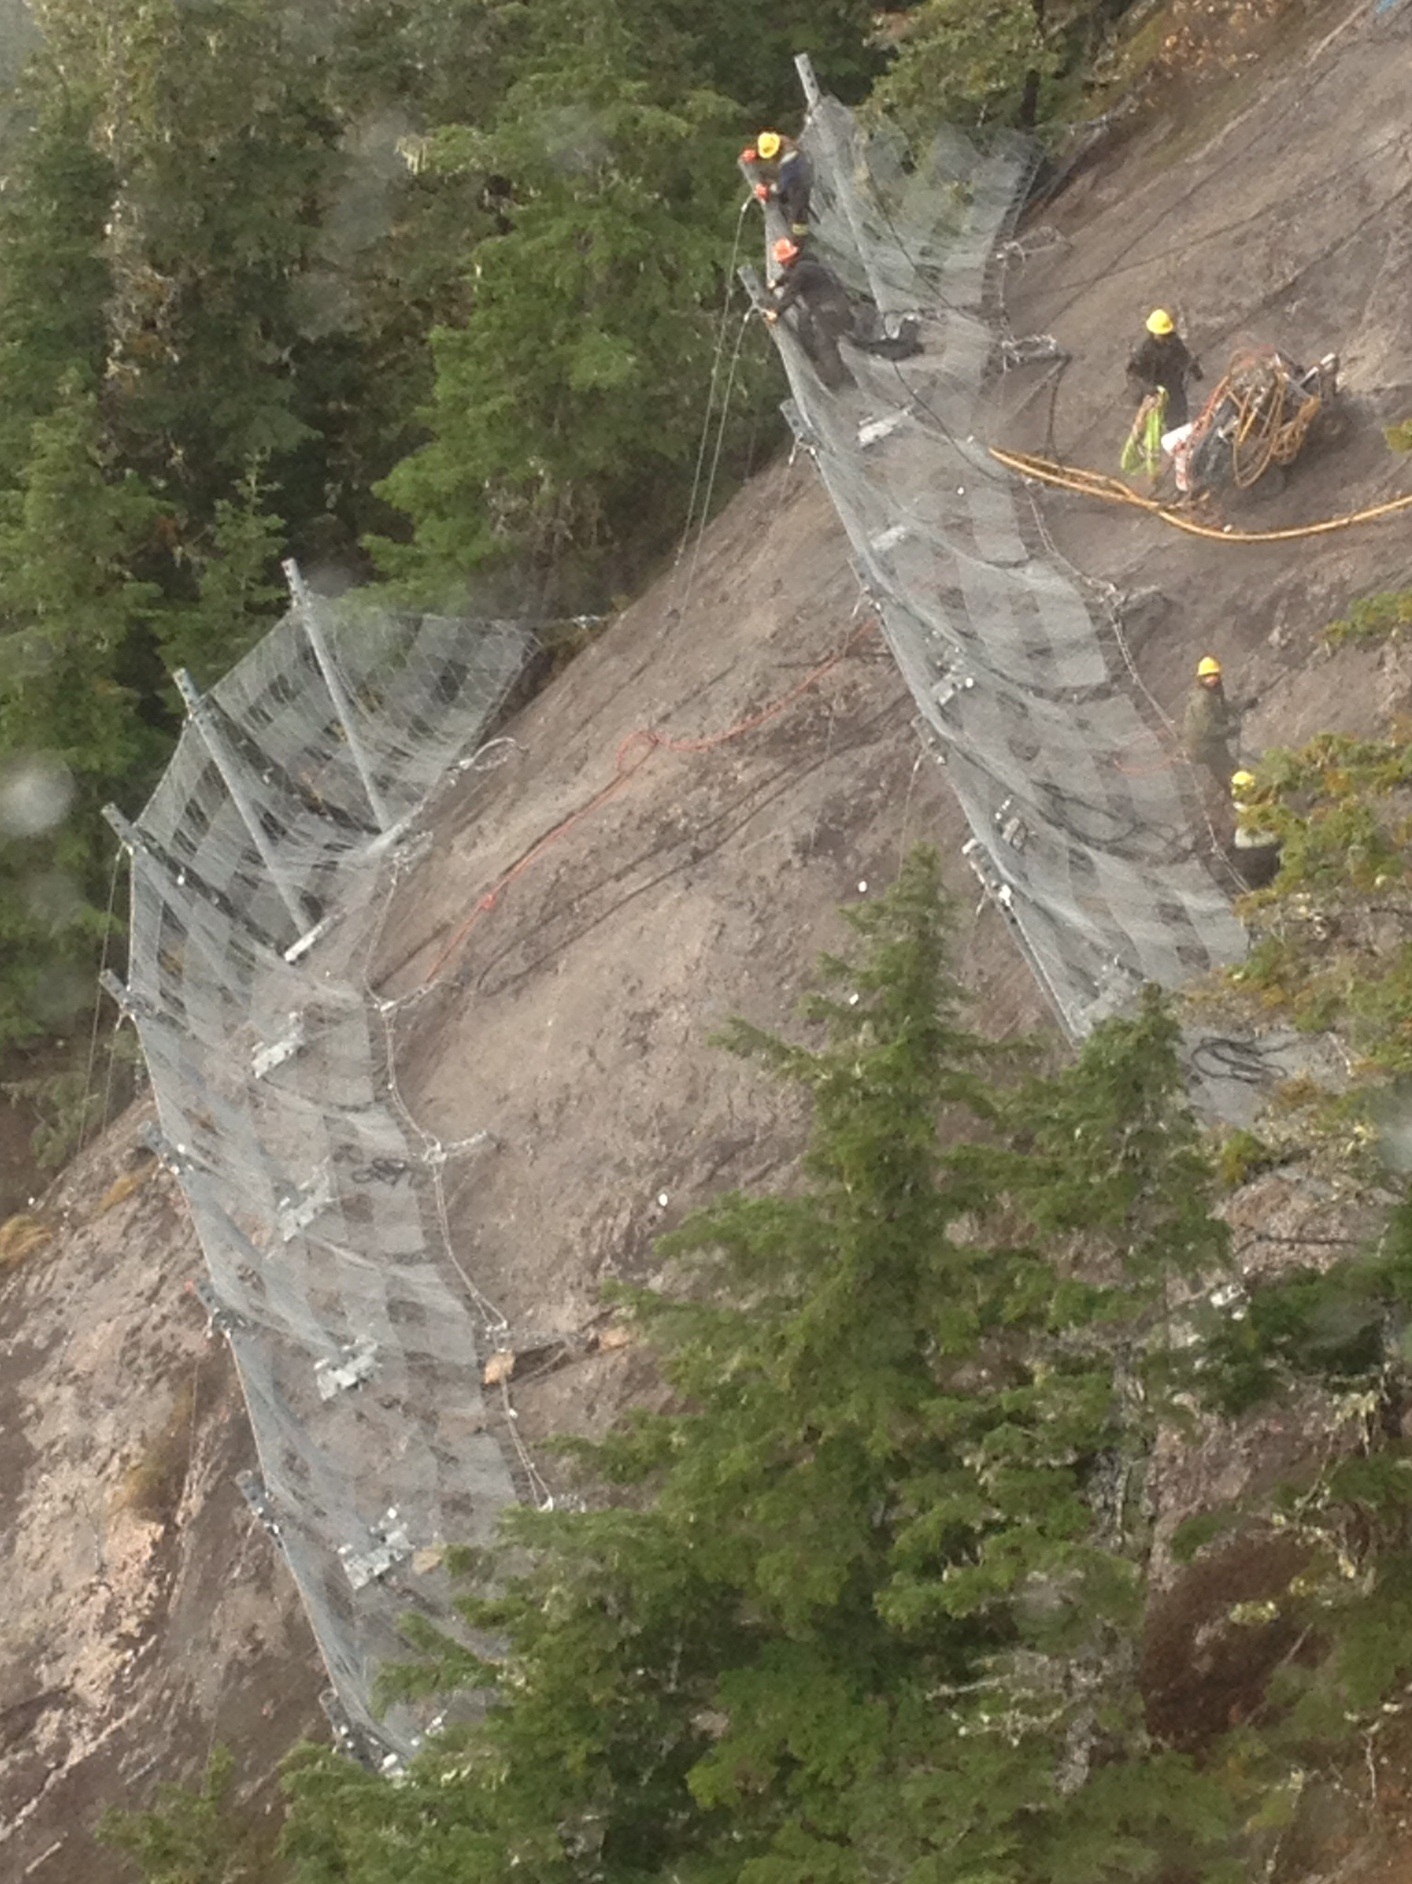
Photo: Pacific blasting and demolition crews perform their work
350 metres above the highway. By Steve Brushey.
With the trial phase fencing installation now complete, the fencing will be monitored throughout the winter of 2014-15 to determine the feasibility of the next phase of avalanche fencing for the East Bluff area. The East Bluff phase requires approximately 400m of fencing to complete the main avalanche area. Once complete, the final phase of ice fall hazard mitigation will follow, requiring an ice retaining structure and drape nets. A short, low elevation rock cut is also a possibility.
Moving ahead, the East Bluff start zones of 35 Mile avalanche area face environmental challenges which include nesting birds, bats and goat kidding areas. In addition, archaeological points of interest need to be preserved. The size of the area will also require the construction of another helicopter pad and many more track occupancy permits from CN Rail. An early analysis suggests the work can be completed over two months which if undertaken during the summer months with longer days and technically better weather, should promote efficiencies and cost savings.
Tags:
avalanche control
avalanche fences
avalanche journal
highway 16
ministry of transportation
MOTI
steve brushey
Permalink
| Comments (0)
|
|
|
Posted By Alex Cooper, Canadian Avalanche Association,
November 6, 2019
|
From volume 104, fall 2013
By Troy Leahey

The start zone. Photo by Jim Bay.
This case study details a skier-triggered avalanche that occurred in the backcountry accessed from Revelstoke Mountain Resort (RMR) on February 22, 2013. The party included five young men, all new to Revelstoke. Three members of the party were involved in the avalanche. Two of these were partially buried; the deceased (an RMR staff member) was fully buried despite wearing an airbag. It was a size 2 slab avalanche with an approximately 40cm fracture line, which failed on an early February surface hoar layer.
Analyzing accidents has long been an important part of the CAA ITP program and in other risk reduction industries. It is easy to be the armchair quarterback after an incident and identify the mistakes people made, but I believe it is also important to identify what was done well in the rescue effort to use as a good learning tool.
My involvement in this accident was on a number of different levels. As a member of Revelstoke Search and Rescue, I assisted Buck Corrigan and Ryan Buhler with the body recovery the day after the accident. I watched and helped interpret a Contour headcam video worn by one of the rescuers during the rescue effort for local members of the RCMP and a representative of the BC Coroners Service. This was a sobering but interesting piece of footage; although the actions of those involved on the scene would be apparent to most readers, the footage required some explanation and interpretation for non-skiing investigators. I interviewed some surviving members of the group for clarification on the location of those involved and their actions for the Coroners Service.
I also led a debrief at RMR for friends and co-workers of the deceased, including the other young men involved in the accident. This debrief was the most challenging public speaking exercise I have ever undertaken. Our company president asked if I could speak about the accident, as staff members and friends in the community had unanswered questions, and answers can help lead to understanding and closure. I wanted to be quite frank about the obvious mistakes made, as they were an opportunity for learning. I also wanted to commend the survivors on their effort and help them recover some confidence and dignity. I focused on the following points in the debrief.

This photo shows the position of the skiers when the avalanche occurred and where they ended up. Their uptrack is in red, the avalanche is outlined in black, and the blue dot is where the victim ended up. Photo by Troy Leahey.
MISTAKES:
• The most obvious mistake was the aggressive terrain choice—the danger rating at alpine and treeline was high. The five males were young, aggressive skiers with limited backcountry experience. This is the demographic we may expect to see on the avalanche fatality list. The deceased had skied in the terrain the day before and felt confident in his decision to lead the rest of the group to that zone. He had spent many days in this area in what had been a mostly stable season to that point. It was also the first major surface hoar cycle we had experienced in the season, and this type of avalanche failure may not have been familiar to a young German in Canada for his first winter. The CAC’s avalanche forecast was bang on—as it usually is—but youth, overconfidence and a desire to ski steep powder caused this glaring information to be ignored.
• Poor group management. The first three skiers on the uptrack were all involved in the avalanche; they were obviously not well spaced out enough and were all engulfed by the slab. Luckily the last two in the group were slower and not affected by the slab failure, and were able to execute a fairly quick rescue. Complacency on uptracks is a common problem for less experienced backcountry travellers. The group of five had been split into the first group of three up front and the slower pair at the back, which leads to a lack of communication and no consensus in the go or no-go decision. The most educated member of the group had been a student of mine on a CAA Avalanche Operations Level 1 course the previous year in Whistler. I spent a lot of time speaking with him about their decisions that day. He admitted to having reservations about the decisions being made, but did not speak up and deferred to the deceased as the leader, since he was most familiar with the terrain.
• Improper use of an avalanche balloon pack. Wear the crotch strap if you are wearing an airbag. The deceased was near the surface with his airbag inflated and clearly visible from 100m away. He had not attached the crotch strap of his airbag. As the overburden of the slab he triggered from mid-slope overran his position in the toe of the debris, the airbag was lifted away from his back and above his head. This caused two serious problems. As the balloons and pack were pushed forward and downhill it lifted the pack, causing the chest strap to catch on his chin and impede his airway. Secondly, the buoyant airbag also pulled the victim’s arms above his head, restricting movement and the ability to use hands to clear his own airway. The Contour video showed quite clearly the victim’s lifeless arms well above his head. The space between the balloon pack and the victim’s back was approximately 40-50cm.

The avalanche path where the victim was caught is on the right. Photo by Jim Bay.
WHAT THE RESCUERS DID WELL:
• The two not involved took a safe route to the toe of the debris and did not expose themselves to any additional hazard. They quickly and efficiently went into rescue mode when they saw the airbag on the surface, and began the excavation by first removing the pack and digging to the head to clear the airway.
• The two partial burials ended up mid-path and were able to self-rescue and do a transceiver search of the slide path down to the victim.
• Group members performed good first aid on the victim. Once they uncovered his head, they immediately cleared an ice chunk from his mouth and pulled him out to a prone position where they started CPR. Considering the environment, they performed excellent CPR with quality air movement as exhibited by the face of the victim in the video.
• The survivor with the most training took control of the rescue effort. He dispatched one of the members of the party to start moving back to the ski area boundary to report the accident as there was no cellular reception on the accident scene. This individual really led the first aid efforts as well.
• After at least a half hour of CPR, they made the decision to try to move the body with an improvised toboggan. They did not get very far as the conditions were very deep, but were able to move the body to a safe location out of the avalanche path. They then made the very difficult decision to leave the body and return to the ski area, as the weather conditions were deteriorating quickly. They left the body in a seated position under a tree with the inflated airbag and flagging tape arranged to mark its position, making our recovery very easy the next morning.
This was an unfortunate accident involving a group of nice young people from around the world enjoying the mountains in Revelstoke. There is nothing ground breaking about this accident other than the question of whether the airbag crotch strap could have made a difference. So why did I write this for The Avalanche Journal on a 30° July day when I’d rather be fishing? On a personal level, it brings back a bunch of vivid images and unpleasant emotions that make me sad. However, on the big-picture level this is an opportunity for others to learn and avoid mistakes in the future. A case study is really a story; this story may be repeated in Whistler, Banff or beyond. Hopefully the mistakes made and the triumphs that occurred in this accident will resonate and help others make better decisions in the mountains. That makes me happy.
Have a fun, safe winter.
Tags:
airbag
avalanche
avalanche journal
case study
companion rescue
fatal
revelstoke mountain resort
troy leahey
Permalink
| Comments (0)
|
|
|
Posted By Alex Cooper, Canadian Avalanche Association,
October 28, 2019
|
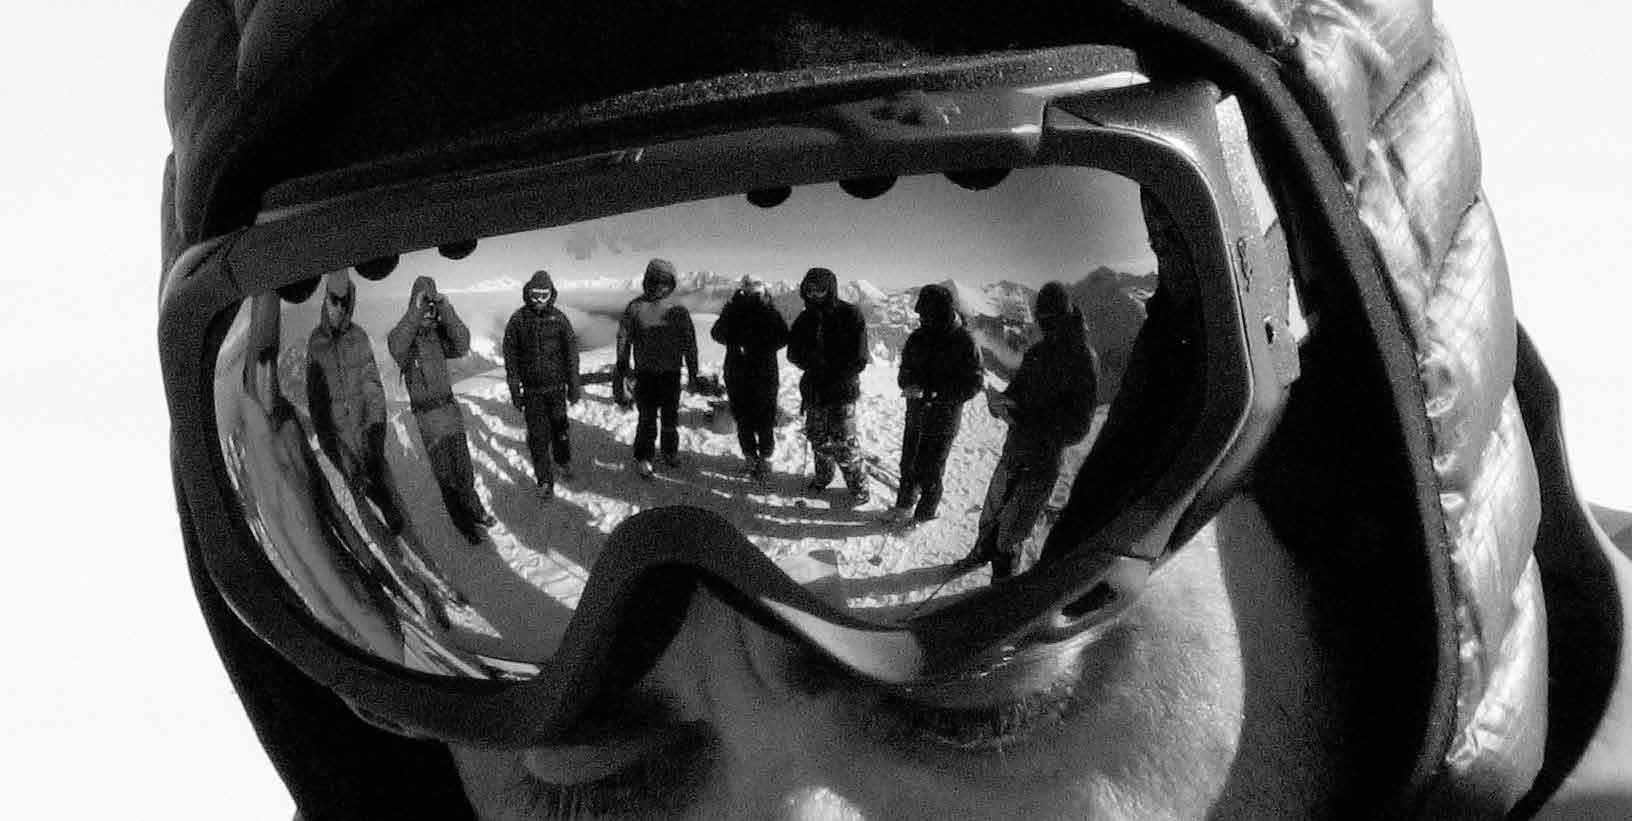
By Roger Atkins
From vol. 120, spring 2019
I first wrote about Strategic Mindset in an appendix to my CAA Level 3 project. Some years later I presented strategic mindset in Banff at ISSW 2014 in a paper entitled “Yin, Yang, and You.” I am surprised by the amount of interest these papers received from professional guides, but also among people doing other types of avalanche safety work. Some guiding operations chose to formally incorporate strategic mindset into their meetings; this is now common practice in North America and elsewhere. The strategic mindset idea originated in the context of guided helicopter skiing, but the concept can be adapted to other endeavours.
During a helicopter skiing operation’s morning meeting, the guides discuss and assess hazards and other considerations for the coming day and produce a ‘run list’ - a binding agreement that excludes some runs from consideration for the day and identifies which other runs are open for guiding. The run list is only the first level of the day’s decisions; many hazards remain on open terrain and actual travel and risk treatment decisions continue throughout the day. I noticed that I automatically take something less tangible than the run list but equally important away from the meeting, something that strongly influences my remaining decisions. I recognize this as a mindset: a personal perspective on the day. This perspective (or filter) makes me wary of certain terrain characteristics. It also establishes a desire for select rewards to seek and attracts me to terrain that offers those experiences.
“When we change our mindset, we actually change the way we
see the world.” - Shelly Carson, Harvard Brain Researcher
As implied by the following definition, a mindset results in an inclination that influences decisions, but it should not be considered a recipe for making decisions.
MINDSET:
1. A fixed mental attitude or disposition that predetermines
a person's responses to and interpretations of situations.
2. An inclination or a habit.
(The American Heritage Dictionary, 2009)
Although strongly related to the discussion around hazard assessment, I also noticed how my mindset is influenced by other factors. Some are personal, such as fatigue or desire; some are operational, such as terrain maintenance through skier traffic. Over time I identified that certain situations repeatedly led to familiar mindsets. It occurred to me that perhaps there is value in identifying familiar situations and in strategically adopting a corresponding mindset.
Guiding operations do not willingly add anything without value to their daily routine, so what does strategic mindset provide that was not there before? One standout benefit is that strategic mindset is a communication tool. The language of strategic mindset can help guides express how they feel about the approach to the day. We have always informally shared our feelings but adding strategic mindset to the meeting agenda makes this more consistent. During the day, it also provides a clear and concise way to communicate if our mindset is changing or if our actions seem inconsistent with the mindset. This communication can help us work better together as a team. Strategic mindset is also useful for communication between operations. Some guides use strategic mindset to communicate with their guests.
Strategic mindset is a deliberate biasing strategy. Although it is typically reflected in the daily run list, I find that my mindset is most relevant to on-the-spot guiding decisions during the day. When approaching a potentially critical terrain feature, we must decide whether to avoid it, to stop and manage the risk, or to just ski right over it. This happens tens of times per day and we are quickly overwhelmed by a detailed analysis of every decision; strategic mindset can simplify many of these decisions. Choices that fit the mindset often require relatively little effort while choices that are out of character with the mindset demand more careful assessment.
Decisions in avalanche terrain are high consequence risk vs reward decisions that are made under uncertainty. Traditional methods and education tend to focus on the hazards and associated risks and completely ignore the reward part, but the potential rewards are the only reason we even accept any risk. We cannot account for our humanity without considering the rewards. Even at the best of times, our written assessments tend to read like a horror show, only identifying hazards and not speaking to positive aspects that enable us to satisfy our desires without unacceptable risk. Strategic mindset is more balanced in that it includes the idea of adjusting one’s desires to fit the situation. Some familiar mindsets bias us toward actions that keep us safe in difficult times while other mindsets enable us to capture our dreams when the opportunity arises.
We are naturally biased toward actions that fulfill our desires. Part of strategic mindset is to adjust our desires to fit the situation, thus creating a motivational bias toward actions that fit the situation. One of my fellow guides summarized a past close call nicely:
“It was a stupid idea...I mean, it was a good idea, but it was the wrong day.”
There are potential downsides to the operational use of strategic mindset. Strategic mindset is a deliberate bias. An appropriate bias is beneficial, but what if we get it wrong? Interestingly, when we make the wrong choice of mindset, I find that it is usually easier to recognize the mistake, change our mindset, communicate the change and adjust our decisions than to re-analyze the hazard assessment and adjust accordingly. Maybe this is because the mindset manifests itself as a feeling rather than the conclusion of an analysis. Nevertheless, it is critical to keep open eyes and an open mind to combat confirmation bias, both for hazard assessment and strategic mindset.
My original list of familiar mindsets is not intended to cover all situations and it can be an undesirable distraction to try to select the right choice from such a list. As implemented at CMH, we are not forced to choose a mindset. We can leave it undetermined or coin a phrase that captures a new strategic mindset, for example High Alert or Spring Transitional. Worthy additions that are concise and self-explanatory will persist; others will naturally die. I encourage expanding the list of familiar mindsets and adapting it to suit your needs. Allow the language of strategic mindset to evolve.
The use of strategic mindset is not a substitute for diligent observation and assessment. Strategic mindset is intentional manipulation of human behaviour to our benefit. It is intended to work in conjunction with a solid foundation based on the fundamentals of avalanche hazard assessment.
Tags:
avalanche journal
roger atkins
strategic mindset
Permalink
| Comments (0)
|
|