From vol. 85, summer 2008
By Matt Macdonald and Mindy Brugman, Operational Meteorologists at the Pacific Storm Prediction Center, Environment Canada
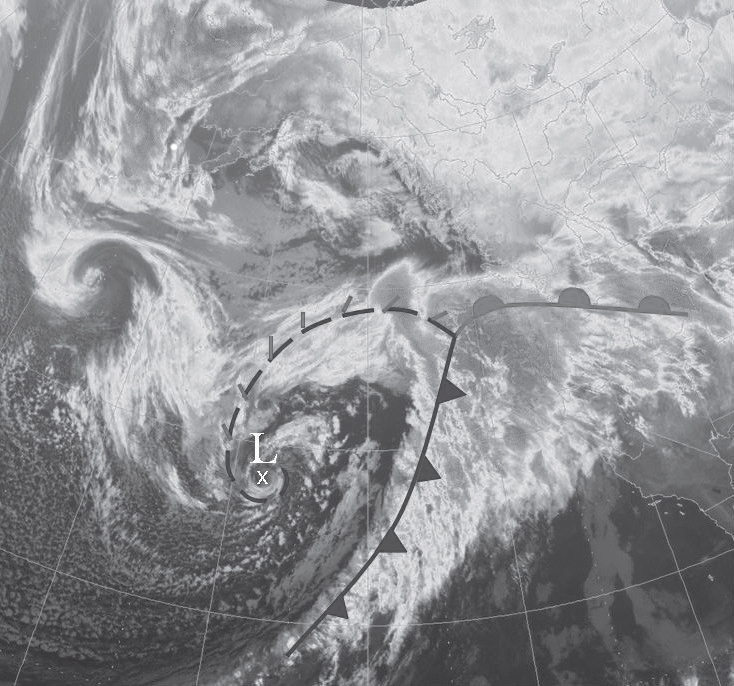
Figure 1: Infra Red satellite image with superimposed fronts of the storm reaching the coast of BC on December 3rd, 2007 at 03:30UTC.
The 2007-2008 winter season posed a great challenge to the entire Canadian avalanche industry. A large part of this challenge was attributable to persistent weak layers (PWLs). The three major PWLs were the December 3 facets-on-crust layer and the two surface hoar-on-crust layers from January 26 and February 25. The latter two layers were essentially the product of prolonged ridges of high pressure. From a meteorological perspective, the December 3rd layer was the result of a much more interesting sequence of storms. In Forecasting Snowpack Troublemakers, we take a look at the ingredients of this Pineapple Express-like event, the performances of short and long range numerical weather models as well as recent tools used by the Pacific Storm Prediction Centre (PSPC) for forecasting these types of events.
Let us first define Snowpack Troublemakers. A Snowpack Troublemaker is any disturbance that creates a significant discontinuity in the weather pattern and consequently the snowpack as well, by bringing heavy snow and/ or rain, strong winds, rapid changes in temperatures/freezing levels or prolonged solar radiation/clear nights. It is important to note that it is the speed and intensity at which these elements change that will determine how much trouble the disturbance brings to the snowpack. The December 3 storm was deemed a Snowpack Troublemaker because it met all of these criteria: heavy snow and rain (70cm of snow followed by 25mm of rain in Revelstoke); sustained winds of 100 km/h with gusts up to 150 at many mountain tops; rises of 15oC in 24 hours across much of BC followed by falling temperatures; prolonged sun and clear nights. This sequence of events resulted in a weak layer that persisted throughout the entire season and was linked to many fatalities and several close calls.
Before the influx of moist and mild air typical of a Pineapple Express reached the coast of BC on December 3, an arctic ridge of high pressure centred over the Yukon was in place. This ridge established an arctic flow of cold air across the province and caused the first segment of precipitation to fall as snow. As the upper atmospheric flow switched from northeast to southwest, the overriding warm air sent freezing levels up to 3,000 metres and transformed the falling snow into rain. As the low pressure system stemming from the tropics approached the coast and deepened, winds strengthened from moderate to extreme. When the low hit the coast, heavy snow gave way to torrential rains (Figure 1). Once the low finally moved inland and weakened on December 5, another arctic ridge set up causing the saturated surface to freeze and facets to form subsequently.
Overall, the evolution of the December 3 storm was well handled by numerical weather models. Both the Canadian GEM and American GFS models hinted at the Pineapple Express event four to five days out. This convergence of guidance provided forecasters with a high level of confidence which in turn allowed us to convey the importance of the high impact weather event on the horizon. In recent years, Ensemble Forecasting Systems have become a mainstay tool for the operational meteorologist. These systems are comprised of multiple numerical models and are left to run out into the 10 to 14 day period. The mean of the ensemble members has proven to deliver a more accurate long range forecast than individual model runs. Both the Canadian and the North American Ensemble Forecasting systems did a great job at signaling the characteristics of a Pineapple Express event as early as 12 days prior to the storm striking (Figure 2). Ensembles are hence of great utility for long range outlooks and are being increasingly incorporated into the forecast process.
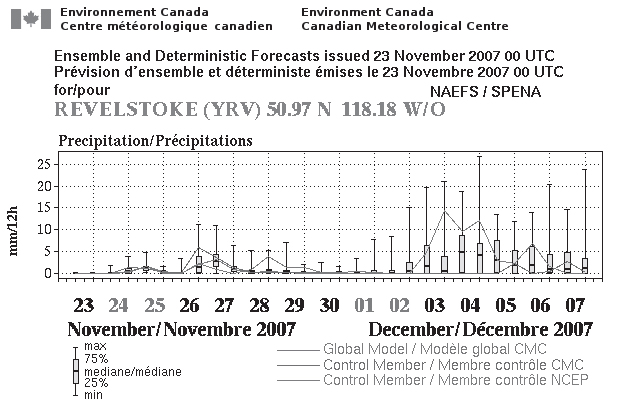
Figure 2: North American Ensemble forecast for Revelstoke issued on November 23rd, 2007, 11 days before the event. Notice the forecasted amounts of 15 to 20 mm per 12 hour period on the day the storm hit.
Another variable that forecasters at the PSPC have been incorporating into their analysis and prognosis is the Madden Julian Oscillation. The MJO is a tropical disturbance that propagates eastward along the equator in a wave like fashion. Its signal is monitored by surveying the outgoing longwave radiation along the equatorial Indian and Pacific oceans. Essentially, this means keeping an eye on convective activity as well as tropical cyclones. The second essential element to be surveyed is wind anomalies at 200hpa as they are responsible for the development of these storms and potentially delivering the surplus of heat and moisture to mid-latitudes. A significant correlation between the activity of the MJO and the storminess in the Pacific Northwest has been observed throughout the past decade. Thus, there has been increased research and development in forecasting the MJO. The Australian Bureau of Meteorology has created a “spider plot” to conceptualize the position and strength of the MJO. The spider plot has proven to be an excellent tool in monitoring and forecasting the potential of Pineapple Express events such as the December 3 storm.
The short term forecast period remains the primary focus of the Pacific Storm Prediction Centre’s alpine forecast. However, as time permits, long range forecasting tools such as Ensembles and the MJO spider plot will be incorporated to provide avalanche industry professionals with more accurate long range forecasts. As more tools get developed and are verified on an operational basis, forecast lead times for significant weather events such as Snowpack Troublemakers will grow and should help the avalanche industry prepare for storms similar to the one on December 3.


