From volume 122, fall 2019
Scott Thumlert1, Grant Statham2, Bruce Jamieson3
1 Alpine Solutions and Canadian Mountain Holidays - corresponding author
2 Parks Canada and Alpine Specialists
3 Snowline Associates Ltd.
“EVEN IF AVALANCHE FORECASTING IS PROBABILISTIC AND INCLUDES UNCERTAINTY, IT SHOULD BE GROUNDED IN CLEAR DEFINITIONS, AND UNCERTAINTY SHOULD NOT STEM FROM NEBULOUS TERMS BUT THE NATURE OF THE PROBLEM.” – JÜRG SCHWEIZER (SCHWEIZER ET AL., 2019).
TWO YEARS AGO, nine of us gathered before breakfast to plan for the day of helicopter skiing ahead. We aimed to talk about the weather, flying conditions, avalanche hazard, and the run list, except there was an argument about the avalanche hazard forecast. Specifically, what likelihood term should be used to assess the persistent slab problem for the day: “possible” or “unlikely.”
The argument wasn’t serious and only resulted in two angry guides and seven frustrated guides wondering how we wasted so much time. Later, I asked the angry guides what they thought the terms “possible” and “unlikely” meant in terms of probability. Guide one said, “Unlikely is about 5%.” Guide two said, “Possible is about 5%.” Their interpretations of “possible” and “unlikely” were exactly the same! The argument was pointless.
The Conceptual Model of Avalanche Hazard (CMAH) (Statham et al., 2018) has been widely adopted in North America as a systematic, risk-based workflow for avalanche forecasting and, in my humble opinion, is a huge achievement for our industry. Now that the model has been in use for several years, we have the opportunity to explore how it is working in the field and look at how well modern risk terminology works for avalanche forecasting. Based on the above story, and many similar ones, a few of us have been wondering what the words used to describe Likelihood of Avalanche(s) actually mean to practitioners as probabilities.
AVALANCHE PRACTITIONER SURVEY
We asked avalanche practitioners from around the world (75 responses) to put a percentage number beside each of the likelihood words from the CMAH (unlikely, possible, likely, very likely, and almost certain) for what they interpreted the words to mean about the probability of avalanches. Figure 1 shows the results.
We observe distinct median values that are similar to forecasting experts in other industries (e.g. Beyth-Marom et al., 1982; Clarke et al., 1992; Reagan et al., 1989). However, we also observe a very large range in probabilities associated with the likelihood terms, and perhaps most importantly, we observe large overlap between categories with average practitioner estimates for “possible” ranging from 2-55% and “unlikely” from 0-35%. This is alarming and it’s not hard to imagine a communication problem developing if one practitioner thinks 5% for “possible” and another uses 35% for “unlikely.”
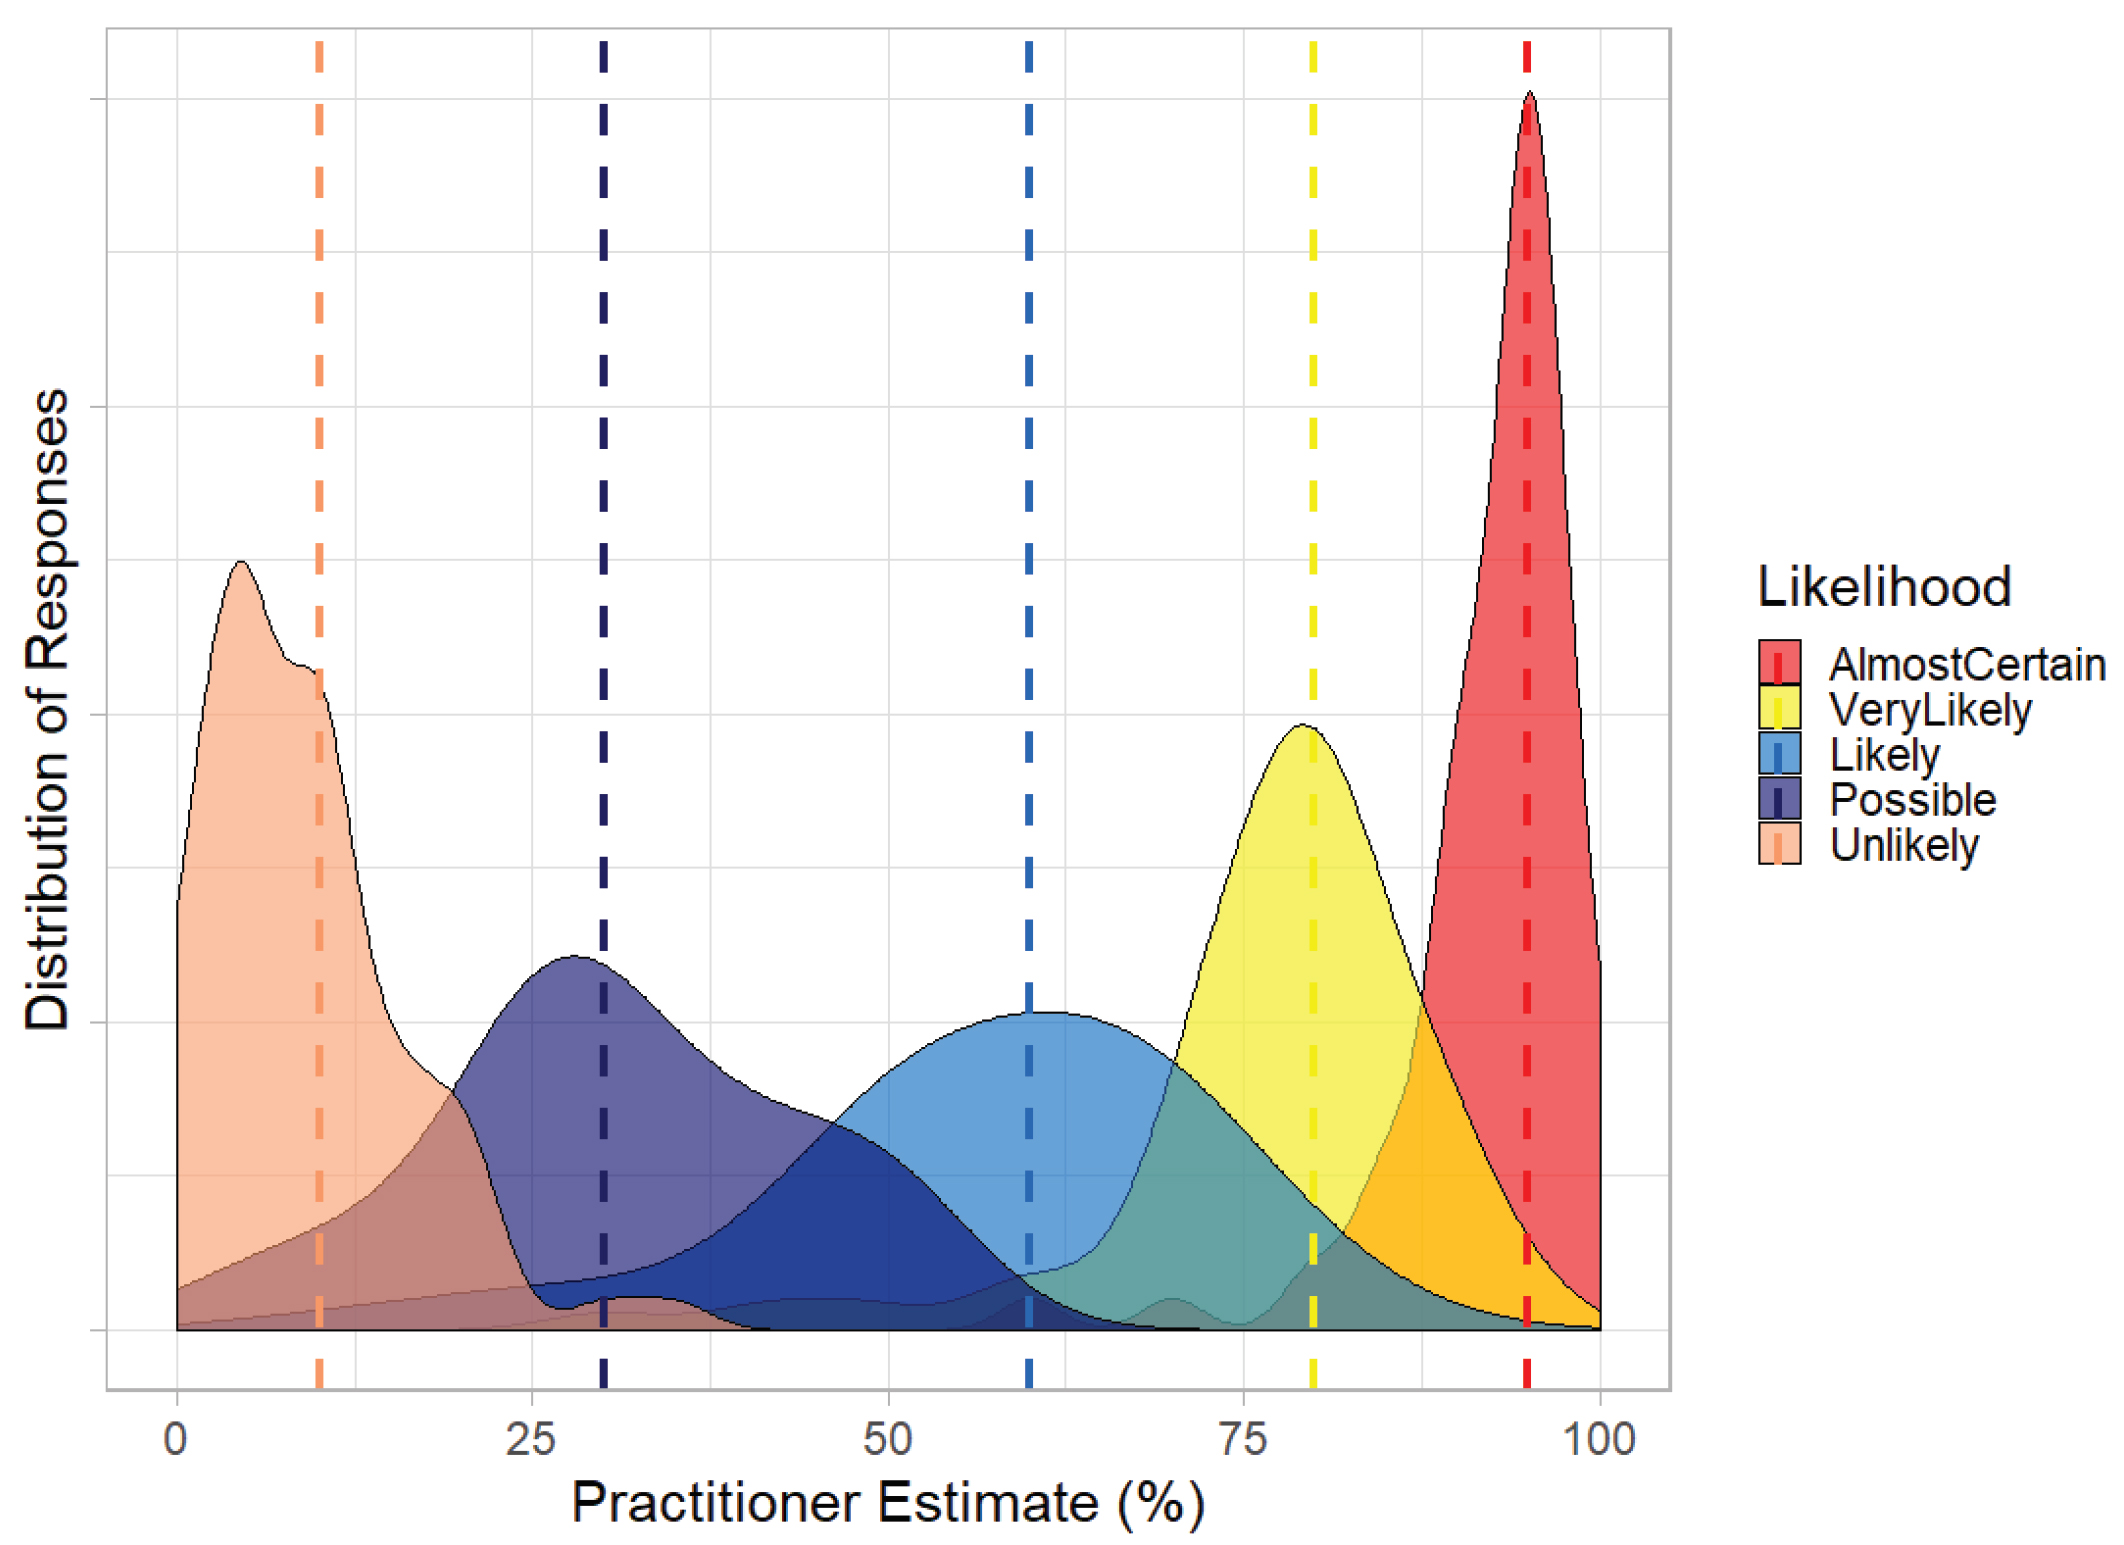
FIG. 1: PROBABILITY INTERPRETATIONS FROM PROFESSIONAL AVALANCHE WORKERS ASSOCIATED WITH WORDS USED TO FORECAST THE LIKELIHOOD OF AVALANCHE(S) (CMAH), WITH MEDIAN VALUES SHOWN AS DASHED LINES.
DISCUSSION OF SURVEY
While this large range and overlap is startling and potentially challenging to work with, it is not altogether surprising. There is a depth of research that has consistently found verbal descriptions of uncertainty, such as “unlikely,” are interpreted differently by different people and also differ widely for the same people in different contexts (e.g. Nakao et al., 1983; Theil, 2002; Morgan, 2017). Are there reasons specific to our industry for the large range and overlap in estimates from avalanche practitioners?
1. Likelihood of Avalanche(s), as defined in the CMAH, results from a combination of “sensitivity to triggers” and “spatial distribution” and has not yet been explicitly defined in terms of numerical probability ranges, meaning avalanche practitioners do not yet have training or guidance on what probabilities we should use for forecasting avalanches.
2. Natural and human-triggered avalanches are rare (e.g. Schweizer et al., 2019), so the experienced-based probabilities from practitioners are likely lower than what many people commonly associate with the likelihood words. Hence, some practitioners provided probabilities for actual human triggered and natural releases (low values), whereas some provided the more common numbers associated with likelihood words (higher values), which contributed to the large range.
3. The reference definition for Likelihood of Avalanche(s) in the CMAH is dependent on the forecast’s spatial scale. It states “Likelihood of Avalanche(s) is the chance of an avalanche releasing within a specific location and time period, regardless of avalanche size.” The likelihood of a single wind slab releasing within the entire North Columbia region will be much higher than the likelihood of a single wind slab releasing on Mt. Rundle.
Discrepancy between interpretations of likelihood expressions has been shown to create communication problems (Fischer and Jungermann, 1996). It can reduce forecasting accuracy (e.g. Rapoport et al., 1990) and ultimately compromise decision making (Friedman et al., 2018). In a classic example, in 1961 during the Cold War, John F. Kennedy asked his Joint Chiefs of Staff to evaluate the planned Bay of Pigs invasion. They assessed the probability of success to be about 30% and communicated that as, “The plan has a fair chance of success.” Kennedy interpreted “fair chance” as favourable odds and approved the operation, which ended in stunning defeat. The Joint Chiefs later reported, “We thought that other people would think ‘fair chance’ would mean ‘not too good.’” The varying interpretations of “fair chance” was the key misunderstanding of the entire project (Wyden, 1979).
Other industries have been working on this problem and have developed strategies we can learn from and potentially adopt. For example, the Intergovernmental Panel on Climate Change (IPCC) has been desperately trying to figure out how to communicate the risks of climate change to the public and policy makers (e.g. Budescu et al., 2014); meteorologists have been promoting the use and communication of probabilistic weather forecasts (e.g. Fundel et al., 2019); and the intelligence industry has developed standards for expressing uncertainty and confidence in judgments (e.g. IDC 203, 2015).
STRATEGIES
Can we incorporate strategies developed by other industries to help with risk communication and forecasting for avalanches? First, we have to make some underlying assumptions:
1. Natural or human-triggered avalanches are relatively rare. Jamieson et al. (2009) estimated the odds of a human triggering a potentially fatal avalanche at considerable danger, skiing one start zone, and “without skilled route selection” between 1:100 and 1:1,000. These odds change by orders of magnitude with varying levels of avalanche hazard. Further, accident data show the risk from natural avalanches is about 10% of the risk from human triggering (Tremper, 2008). Translating these rough odds of encountering a dangerous avalanche into probabilities equates to 0.1-1% for human triggering and 0.01-0.1% for natural releases at considerable danger. For comparison, let’s compare the results from this survey to the North American Public Avalanche Danger Scale (Statham et al., 2010a): “Natural avalanches possible (practitioner estimate = 30%); human-triggered avalanches likely (practitioner estimate= 60%).”
2. Associating probability numbers with likelihood terms improves risk communication (e.g. Budescu et al., 2009; Budescu et al., 2012). Further, explicitly combining the term with the intended numerical range is more effective than having a separate descriptive table (Wintle et al., 2019). Writing “good chance (10-30%) of avalanche release” is more effective than having a separate table describing the 10-30% range for “good chance.”
3. Using frequency statements greatly improves understanding of probabilities and ensures the reference scales are defined (Gigerenzer and Edwards, 2003). For example, a frequency statement for a “20% chance of avalanches” could be translated to “20 out of every 100 avalanche paths.”
Using these assumptions, we propose some ideas for development of the Likelihood of Avalanche(s) scale used to forecast avalanches. It is critical to understand these ideas are provided with the intention of improving risk communication for field decisions, and not to transition avalanche forecasting to numerical calculations.
Limitation statement: these concepts should be interpreted only as ideas for future development and we present them only with the intention of providing an example of what another scale could look like, and to inspire debate, conversation, and further research.
Here are three ideas that have potential to improve risk communication for avalanche work:
1. Consider this definition for Likelihood of Avalanches. Please read carefully: Consider ANY avalanche path in the forecast region where the specified avalanche problem type is expected to exist. Likelihood of Avalanches is the chance of those avalanche paths releasing within the forecast time period, regardless of avalanche size.
For example, PERSISTENT SLABS – BTL (below 1,900 m) on ALL ASPECTS, what is the chance of those paths releasing naturally or from human triggering?
This definition includes the relevant spatial scale: any potential avalanche path. It automatically adjusts to whatever spatial scale is forecasted for. It also allows the translation of probability into frequency descriptions. For example, “Persistent Slabs - Good Chance (10-30%) to size D3” would translate to, “On average 10-30 out every 100 potential paths will release deep slab avalanches.”
2. Associating numerical probability ranges for each word in the scale that are more closely aligned with the underlying rates of avalanche release probability. These probability ranges will be much lower than the results of the survey, and more similar to other natural hazards (e.g. Porter and Morgenstern, 2013). We propose numerical ratings that increase by a half order of magnitude in Table 1. As better data emerge for natural and human-triggered avalanche release rates, these probability ratings can and should evolve.
3. Using chance terms to describe the probability of avalanches as these words are more intuitively associated with lower probabilities. As evidenced in the survey results and literature, likelihood words are already commonly interpreted with underlying probabilities that are much higher than actual avalanche releases. Thus, we need words that can be easily associated with these lower probabilities for use by people working in the field. For example, it is not intuitive for most people to use the word “likely” with a probability of less than 50% (Mauboussin and Mauboussin, 2018). Suggestions are provided in Table 1.
APPLICATION
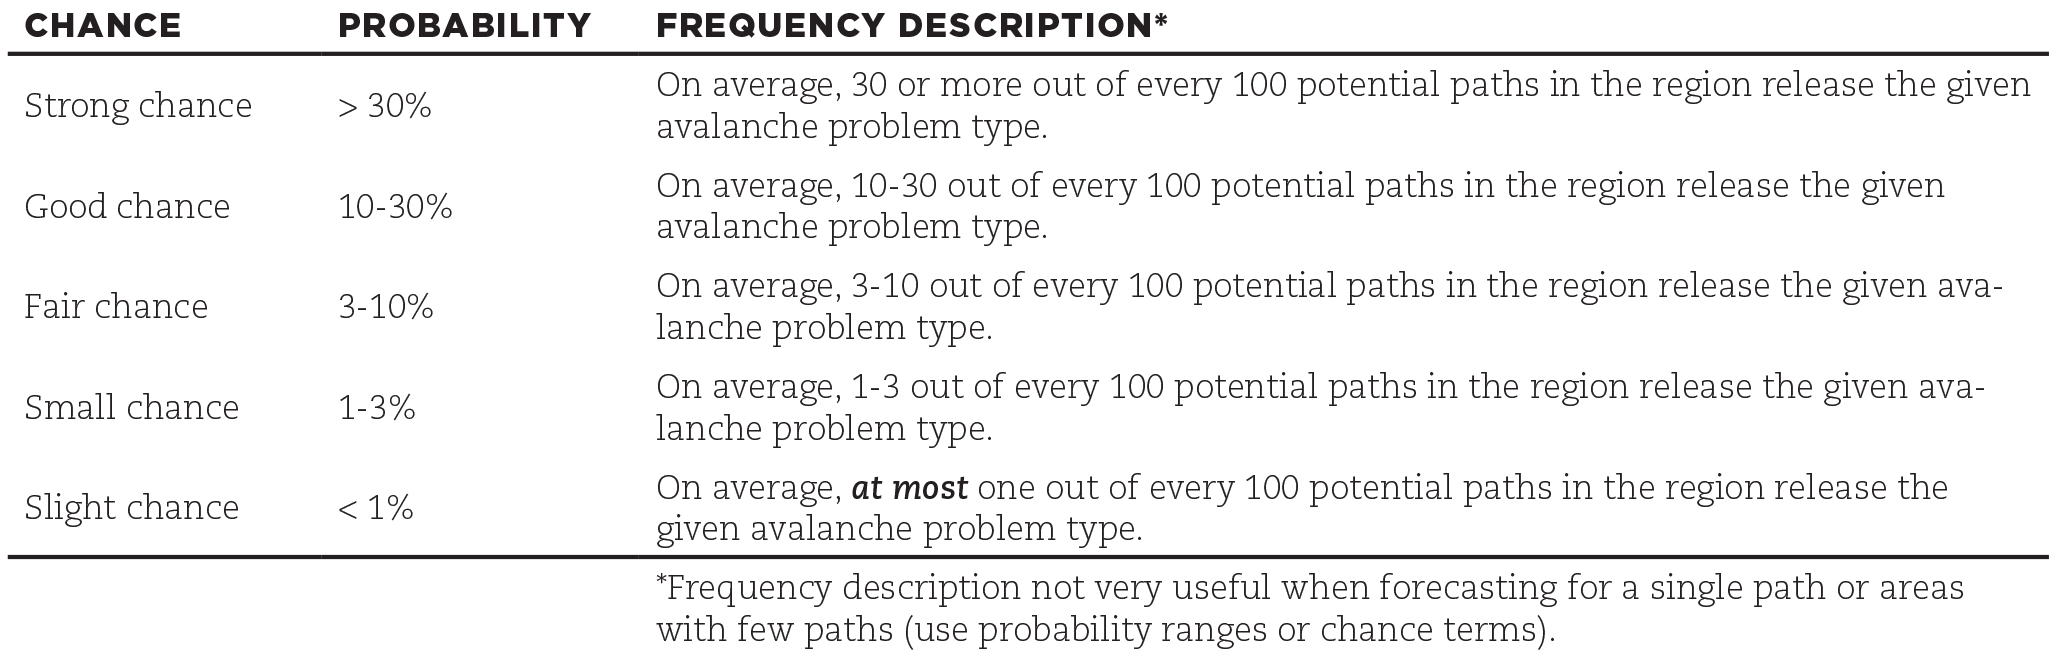
TABLE 1: PROPOSED SCALE DESCRIBING THE LIKELIHOOD OF AVALANCHES.
Table 1 offers forecasters a very different way of evaluating the Likelihood of Avalanches based on estimates of either avalanche frequencies or probability. When forecasters are evaluating a particular avalanche problem, they might (for example) imagine 100 avalanche paths typical to their area that could produce this type of avalanche and then estimate how many of these paths they think will release, both naturally and with human triggers. While the frequency estimate works for areas with many paths, it’s not so useful when evaluating single paths or areas with only a few paths. In these cases, the subjective probability estimates or the chance terms are more appropriate.
INTEGRATION WITH FORECASTING
How would this Likelihood of Avalanches scale combine with avalanche size to produce a hazard rating? Figure 2 shows a potential method to be used as a suggestion or starting point for the hazard rating (after Muller et al., 2016a; Clark and Haegeli, 2018). It should be adjusted by expert judgment as deemed appropriate. More specifically, expert judgment is very much required to combine the various avalanche problem types that may be present in the snowpack into the hazard rating.

FIG. 2: GUIDANCE FOR COMBINING LIKELIHOOD OF AVALANCHES WITH AVALANCHE SIZE TO ASSIGN AVALANCHE HAZARD RATINGS (AFTER MULLER ET AL., 2016A; CLARK AND HAEGELI, 2018).
CONCLUSION AND FUTURE RESEARCH
The surveyed data from avalanche practitioners showed wide variation in interpretation and use of likelihood terms when forecasting avalanches. Differing interpretations of likelihood terms has been shown to reduce forecasting accuracy and compromise decision making, thus we present ideas for improving risk communication when forecasting avalanches (Table 1 and new definition for the Likelihood of Avalanches).
We suggest these and any other terms used in the future should reflect underlying data for avalanche release probabilities. As an example, the important paper by Schweizer et al. (2019) attempts to establish the relationship between avalanche occurrence and the avalanche danger level. We strongly encourage future studies like this with robust avalanche occurrence datasets to better define probabilities of avalanche release.
REFERENCES
Beyth-Marom, R., 1982. How probable is probable? A numerical translation of verbal probability expressions. J. Forecast. 1: pp. 257-269.
Budescu, D., Broomell, S., Por, H., 2009. Improving Communication of Uncertainty in the Reports of the Intergovernmental Panel on Climate Change. Psych. Sci. 20: pp. 299-308.
Budescu, D., Por, H., Broomell, S., 2012. Effective Communication of Uncertainty in the IPCC Reports: A Nationally Representative Survey. Climatic Change 113: pp. 181-200.
Budescu, D., Por, H., Broomell, S., Smithson, M., 2014. The interpretation of IPCC probabilistic statements around the world. Nature Climate Change. DOI: 10.1038/NCLIMATE2194.
Clark, T., Haegeli, P., 2018. Establishing the link between the conceptual model of avalanche hazard and the North American public avalanche danger scale: Initial explorations from Canada. Proceedings International Snow Science Workshop, Innsbruck 2018: pp. 1116-1120.
Clarke, V., Ru n, C., Hill, D., Beamen, A., 1992. Ratings of orally presented verbal expressions of probability by a heterogeneous sample. J. Appl. Soc. Psychol. 22: pp. 638-656.
Fischer, K., Jungermann, H., 1996. Rarely occurring headaches and rarely occurring blindness: Is rarely = rarely? The meaning of verbal frequentistic labels in specific medical contexts. J Behav Decis Mak. 9:153–72.
Friedman, J., Baker, J., Mellers, B., Tetlock, P., Zeckhauser, R., 2018. The Value of Precision in Probability Assessment: Evidence from a Large-Scale Geopolitical Forecasting Tournament. International Studies Quarterly, Volume 62, Issue 2, June 2018: pp. 410–422. https://doi.org/10.1093/isq/sqx078
Fundel, V., Fleischhut, N., Herzog, S., Gober, M., Hagedorn, R., 2019. Promoting the use of probabilistic weather forecasts through a dialogue between scientists, developers and end‐users. Quarterly Journal of the Royal Meteorological Society. https://doi.org/10.1002/qj.3482
Gigerenzer, G., Edwards, A., 2003. Simple tools for understanding risks: from innumeracy to insight. BMJ 2003; 327:741. doi: https://doi.org/10.1136/bmj.327.7417.741.
Intelligence Community Directive 203, 2015. Analytic Standards. Office of the Director of National Intelligence United States of America.
IPCC: Mastrandrea, M., Field, C., Stocker, T., Edenhofer, O., Ebi, K., Frame, D., Held, H., Kriegler, E., Mach, K., Matschoss, P., Plattner, G., Yohe, G., and F., Zwiers, 2010. Guidance Note for Lead Authors of the IPCC Fifth Assessment Report on Consistent Treatment of Uncertainties. Proceedings from IPCC meetings at Jasper Ridge, CA, USA.
Jamieson, B., Schweizer, J., Shea, C., 2009. Simple Calculations of Avalanche Risk for Backcountry Skiing. Proceedings International Snow Science Workshop, Davos 2009: pp. 336-340.
Porter, M., Morgenstern, N., 2013. Landslide Risk Evaluation: Canadian Technical Guidelines and Best Practices related to Landslides: a national initiative for loss reduction. Geological Survey of Canada, Open File 7312, 21.doi:10.4095/292234.
Mauboussin, A., Mauboussin, M., 2018. If you say something is “likely”, how likely do people think it is? Harvard Business Review. https://hbr.org/2018/07/if-you-say-something-is-likely-howlikely-do-people-think-it-is
Muller, K., Mitterer, C, Engeset, R., Ekker, R., Kosberg, S., 2016a. Combining the Conceptual Model of Avalanche Hazard with the Bavarian Matrix. Proceedings International Snow Science Workshop, Breckenridge, Colorado, 2016: pp. 472 – 479.
Nakao, M., Axelrod, S,. 1983. Numbers are better than words, Verbal specifications of frequency have no place in medicine. The American Journal Of Medicine. 74(6):1061–5. PMID: 6859055.
Rapoport, A., Wallsten, T., Erev, I., Cohen, B., 1990. Revision of opinion with verbally and numerically expressed uncertainties. Acta Psychologica. 74: pp. 61–79. https://doi.org/10.1016/0001-6918(90)90035-E 000169189090035E.
Reagan, R., Mosteller, F., Youtz, C., 1989. Quantitative meanings of verbal probability expressions. J. Appl. Psychol. 74: pp. 433-442.
Schweizer, J., Mitterer, C., Techel, F., Stoffel, A., Reuter, B.: On the relation between avalanche occurrence and avalanche danger level, The Cryosphere Discussions. https://doi.org/10.5194/tc-2019-218, in review, 2019.
Statham, G., Haegeli, P., Birkeland, K., Greene, E., Israelson, C., Tremper, B., Stethem, C., McMahon, B., White, B., Kelly, J., 2010a. The North American public avalanche danger scale. Proceedings of the 2010 International Snow Science Workshop, Squaw Valley, CA: pp. 117–123.
Statham, G., Haegeli, P., Greene, E., Birkeland, K., Israelson, C., Tremper, B., Stethem, C., McMahon, B., White, B., Kelly, J., 2018. A Conceptual Model of Avalanche Hazard. NatHazards 90: pp. 663–691. https://doi.org/10.1007/s11069-017-3070-5.
Theil, M., 2002. The Role of Translations of Verbal into Numerical Probability Expressions in Risk Management: A Meta-Analysis. Journal of Risk Research 5 (2): pp. 177–186.
Tremper, B., 2008. Staying Alive in Avalanche Terrain, 2nd edition. The Mountaineers Books, Seattle, Washington, USA: pp. 15.
Wintle, B., Fraser, H., Wills, B., Nicholson, A., Fidler, F., 2019. Verbal probabilities: Very likely to be somewhat more confusing than numbers. PLoS ONE 14(4): e0213522. ttps://doi.org/10.1371/journal.pone.0213522
Wyden, P., 1979. Bay of Pigs: The Untold Story. New York: Simon and Schuster


